Figures & data
Figure 1. Tissue specimens of human RE (A) and ON (B). Sections through the human RE and ON stained with hematoxylin and eosin (H&E) (C–D) and Alcian blue (E). Paraffin-section of representative ON is immunostained for OMP and CK18 . Nuclei are labeled with DAPI (F). Immunofluorescence images of cultured RECs and ONCs. Cilia (G) and OMP (H) are identified with DyLight488. Cellular cytoskeletal shape (F-actin) is outlined by rhodamine phalloidin. Scale bar= 20 μm.
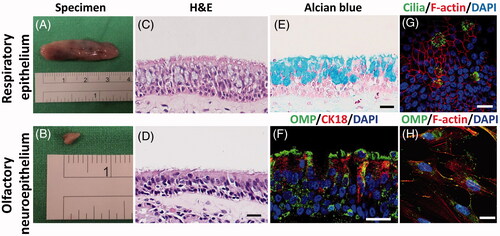
Figure 2. Determination of optimal concentrations and molecular weights of CS and HA with Western blot analyses. ONCs are treated with various concentrations of CS (A) and different molecular weights of CS (B). RECs are incubated with different molecular weights of HA (C).
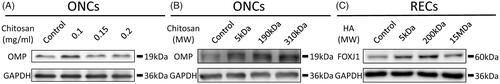
Figure 3. Morphology and cell-cell boundaries of RECs treated with/without HA (2 mg/ml) and CS (0.1 mg/ml) at day 21 after ALI using light microscope (A, left panels) and scanning electron micrographs (A, middle panel, magnification 1500×). Immunofluorescent confocal images of ZO-1 (A, right panels, 400×). Cellular cytoskeletal shape (F-actin) is outlined by rhodamine-phalloidin. Nuclei are labeled with DAPI. B: Western blot analyses of tight junctions (ZO-1 and E-cadherin) in RECs (top). Densitometric analyses (bottom). Scale bar = 20 μm. Different letters indicate significant differences, while the same letter indicates no significant differences (n = 5, p < .05).

Figure 4. Cilia formation are observed using scanning electron micrographs (Magnification × 10000, Scale bar = 2 μm). Immunofluorescent confocal images of MUC5AC (630×) and cilia (400×) at day 21 after ALI (A). Cellular cytoskeletal shape (F-actin) is outlined by rhodamine-phalloidin. Nuclei are labeled with DAPI. The expression of FOXJ1 and MUC5AC are evaluated using Western blotting assays and densitometric analyses (B). Scale bar = 20 μm. Different letters indicate significant differences, while the same letter indicates no significant differences (n = 5, p < .05).
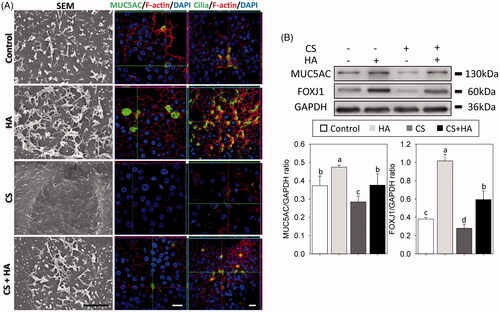
Figure 5. Morphology and differentiation of ONCs treated with/without HA (2 mg/ml) and CS (0.1 mg/ml) for one week. The OMP-, CK18-, ADCY3-positive cells are immunostained with DyLight488 (400×). Cellular cytoskeletal shape (F-actin) is outlined by rhodamine-phalloidin. Nuclei are labeled with DAPI. Scale bar = 20 μm.
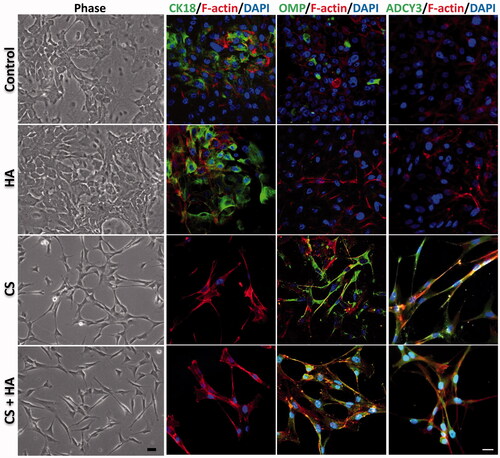
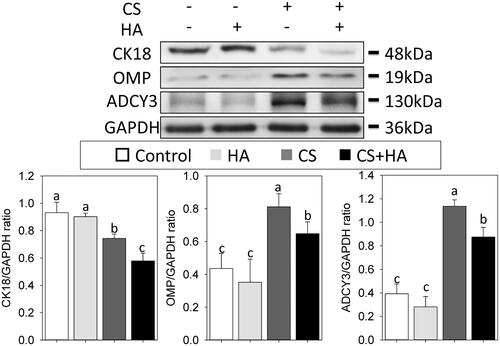
Figure 6. Western blot analyses of ONCs. The expressions of CK18, OMP, and ADCY3 are assessed by Western blot assay and densitometric analyses. Different letters indicate significant differences, while the same letter indicates no significant differences (n = 5, p<.05).