Figures & data
Figure 1. Protein patterns of poly-cHbs with a GTA concentration range from 0.025 to 0.300% (A and B). Poly-hHbs with a GTA concentration range of 0.025–0.300% (C and D).
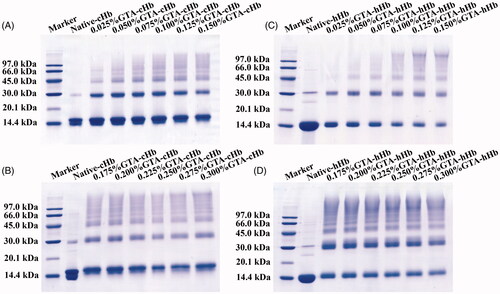
Table 1. The average particle sizes and diffusion properties of hemoglobin samples.
Figure 2. Circular dichroism spectra of cHbs (A and B) and hHbs (C and D) were recorded at 25 °C in the far-UV region of 200–250 nm and near-UV region of 250–480 nm.
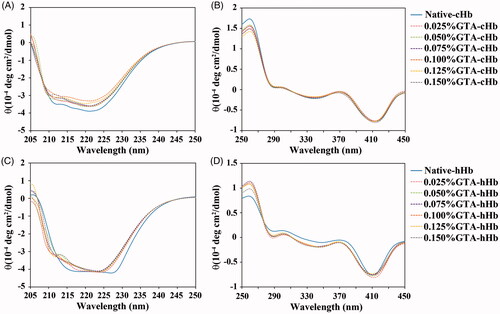
Figure 3. Ratio of secondary structure changes of cHbs (A) and hHbs (B). The decrease of α-helix structure and increase of β-sheet and β-turn structure have been observed along with the increase of GTA concentration.
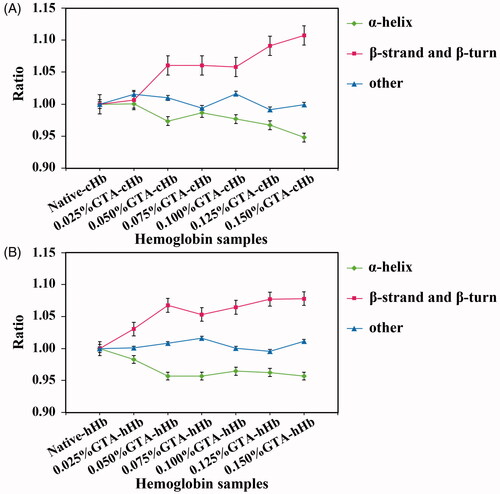
Table 2. Secondary structure contents of hemoglobin samples.
Figure 4. UV-Vis spectra of cHb (A) and hHb samples (B) were recorded at 250–480 nm at 25 °C.
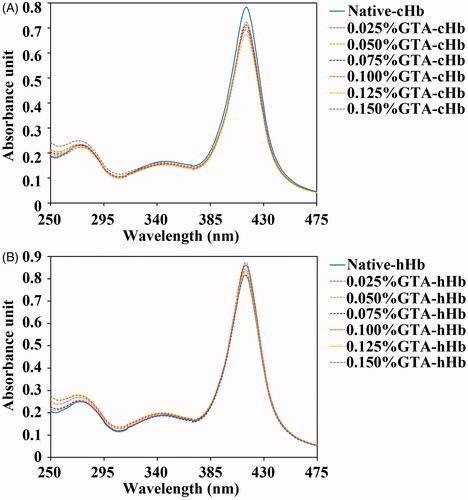
Figure 5. Ratio of the Soret band intensity of cHb and hHb samples.
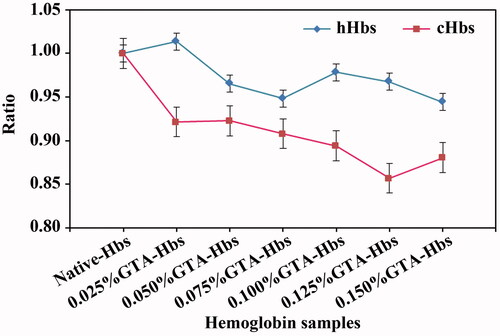
Figure 6. UV-Vis spectra of cHb (A) and hHb samples (B) were recorded at 475–700 nm at 25 °C.
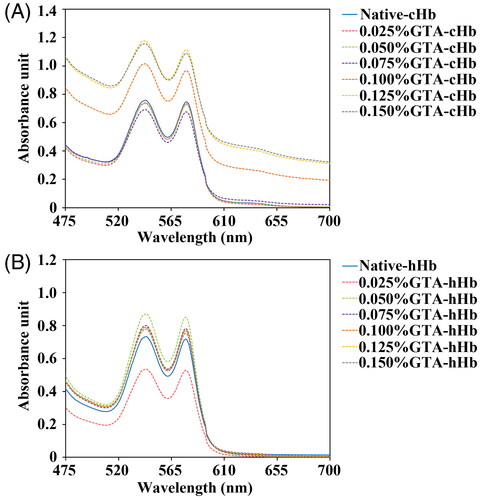
Figure 7. Oxygen equilibrium curves of Native-Hb samples (A), Poly-cHb samples (B), and Poly-hHb samples (C).
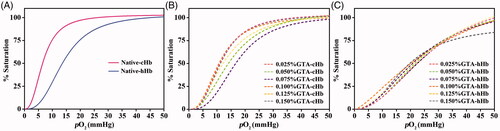
Figure 8. The ratio of P50 values of cHb and hHb samples.
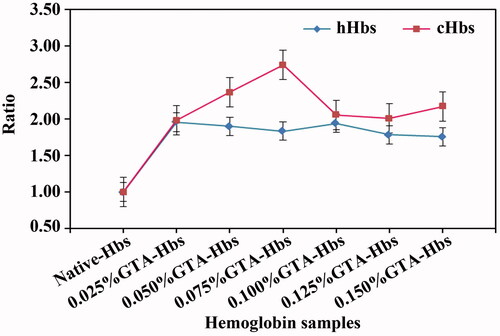
Table 3. The P50 value and Hill’s cooperativity coefficient (n) of Hb samples.
Table 4. The Bohr coefficient (δH+) of native-cHb and 0.025%GTA-cHb.
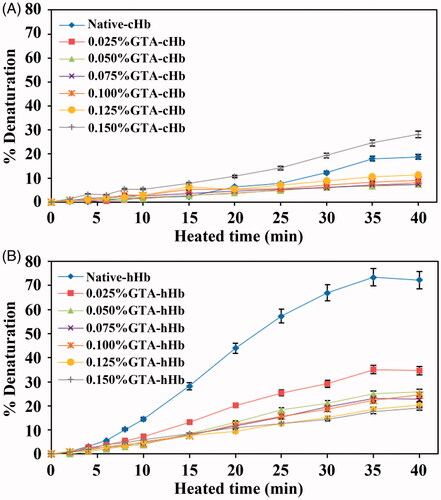
Figure 9. Thermal denaturation analysis of cHb samples (A) and hHb samples (B).