
Figures & data
Table1. Forward and reverse sequence of different primers [Citation31].
Figure 1. LS-180 cell survival at different concentrations of astaxanthin after 24, 48 and 72 h of treatment.
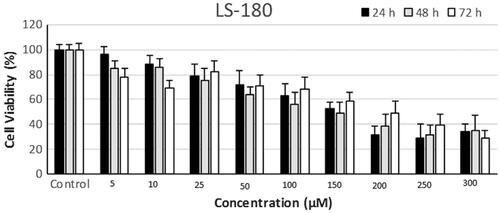
Figure 2. Caspase 3 gene expression in the LS-180 cell line. The expression of genes was measured using the Real-Time PCR technique and compared to control cells. The results are repeated three times and tested as Mean ± SEM. The columns that have had a significant difference after the DDCT test are marked with a star sign. The significance level is considered to be P < .01 (**P < .01).
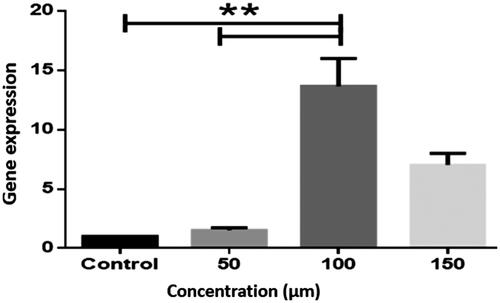
Figure 3. Bax gene expression in the LS-180 cell line. The expression of genes was measured using the Real-Time PCR technique and compared to control cells. The results are repeated three times and tested as Mean ± SEM.
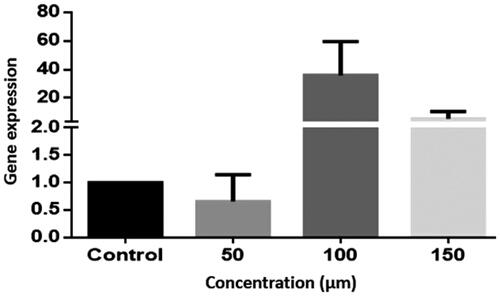
Figure 4. Expression of bcl-2 gene in LS-180 cell line. The expression of genes was measured using the Real-Time PCR technique and compared to control cells. The results are repeated three times and tested as Mean ± SEM. The columns that have had a significant difference after the DDCT test are marked with a star sign. The significance level is considered to be P < .01. (**P < .01).
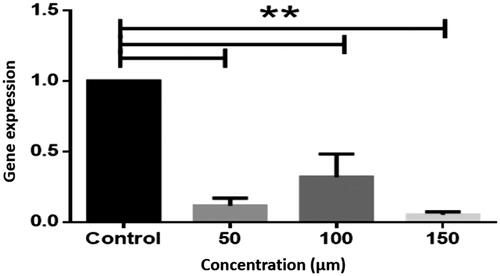
Table 2. Results of the effect of astaxanthin on the level of malondialdehyde and the activity of antioxidant enzymes in the LS-180 cell line.