Figures & data
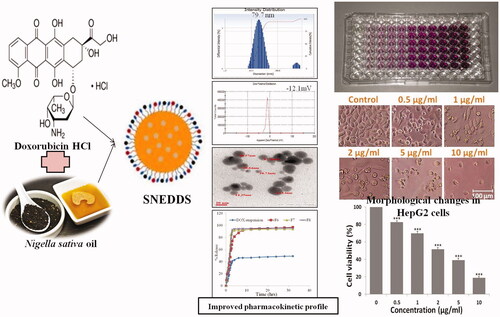
Figure 1. Solubility of doxorubicin and Nigella sativa oil in (a) various oils (b) surfactants and co-surfactants.
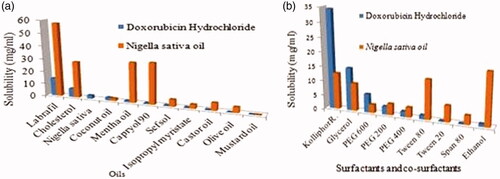
Table 1. Composition of SNEDDS formulation using labrafil: Nigella sativa oil (3:2), kolliphor RH 40, glycerol and deionized water.
Table 2. Observations for dispersability testing in SNEDDS.
Figure 2. Pseudo ternary phase diagrams of DOX SNEDDS, (Smix 1:0, Smix 1:1, Smix 1:2, Smix 2:1, Smix 3:1 and Smix 4:1).
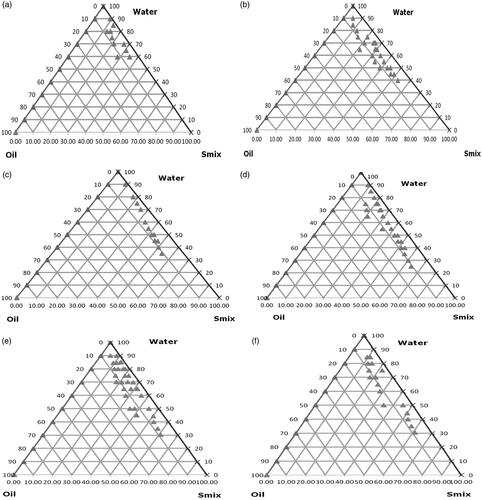
Table 3. Thermodynamic stability tests of prepared nanoformulation.
Table 4. Droplet size, polydispersity index, zeta potential, viscosity, refractive index, conductivity, and percent transmittance of selected DOX SNEDDS formulations.
Figure 3. DOX SNEDDS: (a) Droplet size (F6), (b) zeta potential (F6), and (c) surface morphology of DOX SNEDDS by transmission electron microscopy, and (d) in vitro release profile of prepared SNEDDS in PBS 6.8.
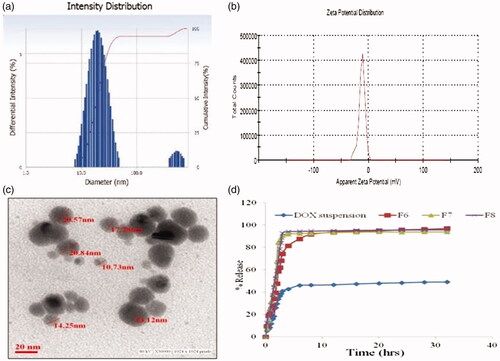
Figure 4. Photomicrograph showing effect to DOX SNEDDS against Chang liver cells of non-malignant human liver cells. (A) Showing morphological changes in Chang liver cells at higher doses i.e. 5 and 10 µg/ml concentrations of DOX SNEDDS. (B) Graph representing the % cell viability of Chang liver cells after treated with various concentrations (0.5, 1, 2, 5 and 10 µg/ml) of DOX SNEDDS.
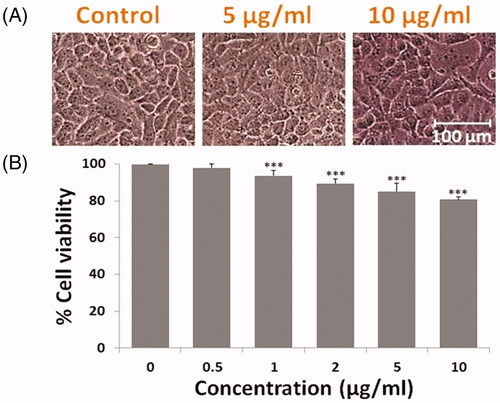
Figure 5. Anti-proliferative effect to DOX SNEDDS against HepG2 cells of human liver carcinoma. (A) Showing morphological changes in HepG2 cells after treated with 0.5, 1, 2, 5 and 10 µg/ml concentrations of DOX SNEDDS. (B) Graph representing the % cell viability of HepG2 cells after treated with various concentrations (0.5, 1, 2, 5 and 10 µg/ml) of DOX SNEDDS.
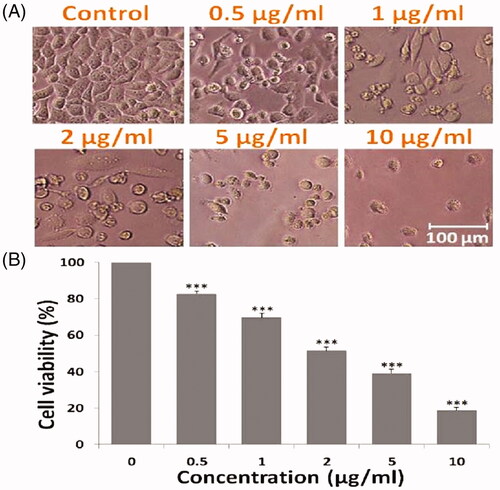
Figure 6. Nuclear fragmentation and apoptosis caused by DOX SNEDDS against human hepatic carcinoma HepG2 cells after 24 h. (A) Photomicrograph showing nuclear apoptosis in HepG2 cells after treated with 1, 2 and 5 µg/ml concentrations of DOX SNEDDS. (B) Graph representing the % apoptotic HepG2 cells after treated with selected effective concentrations (1, 2 and 5 µg/ml) of DOX SNEDDS.
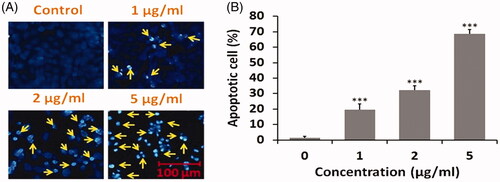
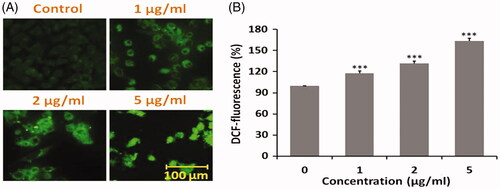
Figure 7. Intracellular ROS production in HepG2 cells after treated with DOX SNEDDS. (A) Photomicrograph showing intracellular ROS production in HepG2 cells after treated with 1, 2 and 5 µg/ml concentrations of DOX SNEDDS. (B) Graph representing the % ROS production in HepG2 cells after treated with selected effective concentrations (1, 2 and 5 µg/ml) of DOX SNEDDS.