Figures & data
Figure 1. Scanning electron microscopy images of RIF/MOX–PLGA (a1, a2) and MOX–PLGA microspheres (b1, b2). Scale for size of microspheres in a1 and b1 is 50 μm. Scale for size of microspheres in a1 and b1 is 10 μm.
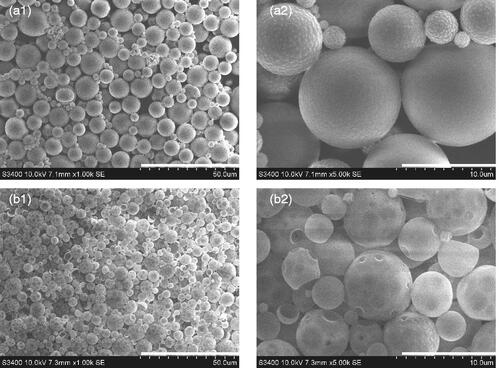
Figure 2. Particle size distribution of RIF/MOX–PLGA (a) and MOX–PLGA microspheres (b).
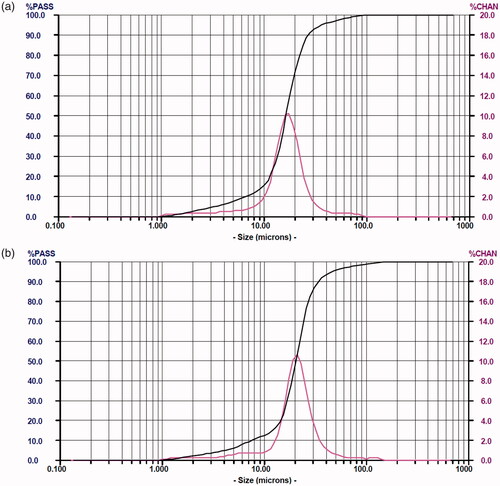
Figure 3. In vitro MOX release curves from MOX–PLGA microspheres (a) and in vitro MOX and RIF release curves from RIF/MOX–PLGA microspheres (b).
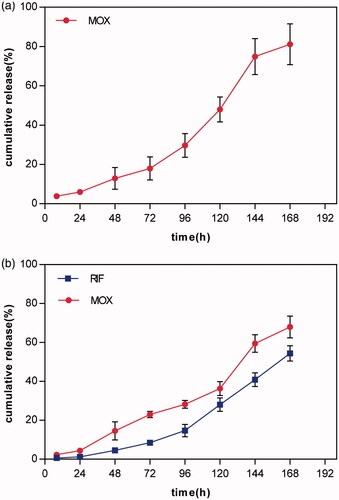
Figure 4. Results of the time-kill assay of the unloaded PLGA, MOX–PLGA and RIF/MOX–PLGA microspheres (a,b).
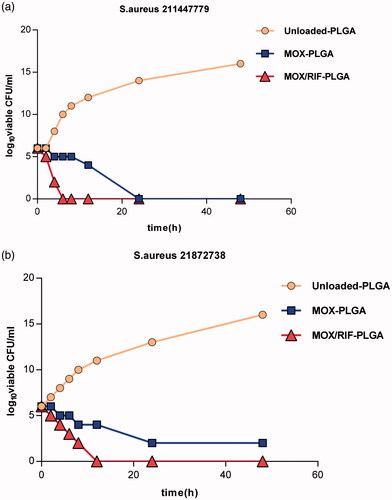
Figure 5. Inhibition zone under different time points exhibited by the emulsion medium from MOX–PLGA microspheres and RIF/MOX–PLGA microspheres against S. aureus 211447779 (a) and 21872738 (b).
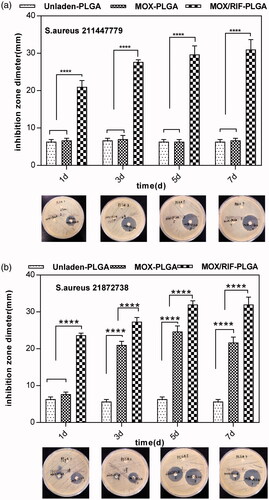
Figure 6. Results at different time points using the emulsion medium against both preliminary (a1, a2) and mature (b1, b2) stages of biofilm formation. The level of crystal violet absorption was used to estimate biofilm formation.*p < .05 was considered statistically significant.
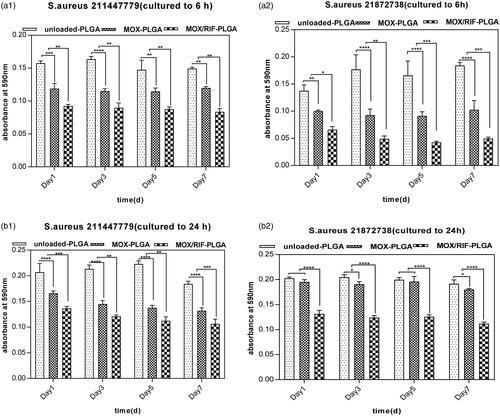
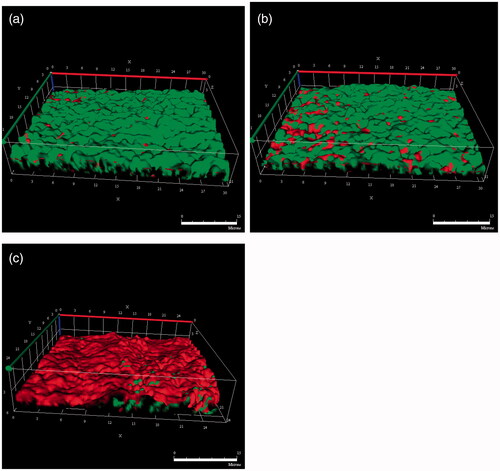
Figure 7. Mature biofilms on microslide were treated with emulsion media from unloaded PLGA (a), MOX–PLGA (b) and RIF/MOX–PLGA microspheres (c), and the biofilm was cultured for 24 h and observed using confocal laser scanning microscopy after BacLight dead/live staining.