Figures & data
Figure 1. (A) Scanning electron microscopy (SEM) image of optimum REO-NLCs formulation. The profile of (B) particle size and (C) zeta potential for REO-NLCs formulation.
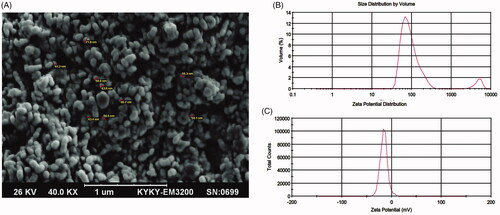
Table 1. The mean of diameter zone (mm) in experimental groups.
Table 2. The data for MIC and MBC in REO and REO-NLCs groups.
Figure 2. Effect of REO and REO-NLCs gels on wound area (mm2) on different days. Six animals in each group. Superscripts (a–b) show significant differences among groups on same day.
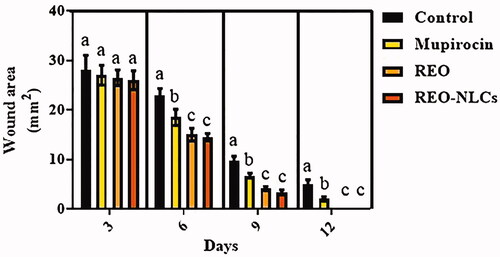
Figure 3. Effect of REO and REO-NLCs gels on total bacterial count (CFU/g) in different days. Six animals in each group. Superscripts (a–b) show significant differences between other groups and control.
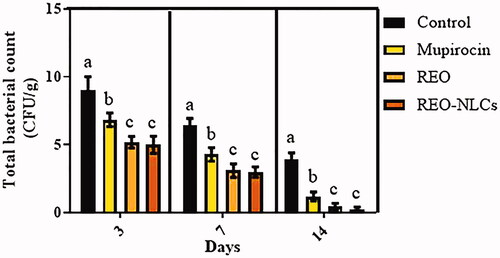
Figure 4. Histological section from wound area on day 3 after wound induction; immuno-fluorescent staining for fibroblast are presented in first row (A1–D1). See that REO-NLCs and the REO significantly stimulated the fibroblasts infiltration. Figure A2–D2 are representing the granulation tissue generation in different groups. See well-formed granulation tissue in REO and REO-NLCs-treated groups versus mupirocin and control animals. The software analyses for fibroblast distribution are represented in Figure A3-D3. See intensive fibroblast distribution in REO-NLCs-treated group (A: Control, B: Mupirocin-treated, C: REO-treated and D: REO-NLCs-treated).
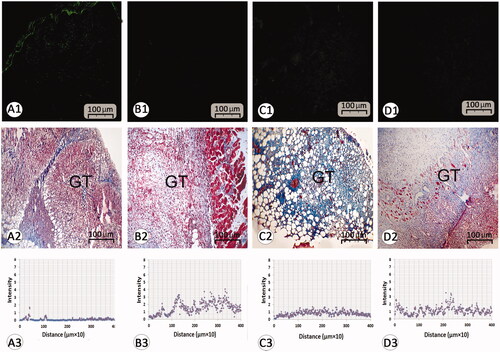
Figure 5. Histological section from wound area on day 14 after wound induction; (A1–D1) immuno-fluorescent staining for fibroblast are presented in first row (A1–D1). See that REO-NLCs and the REO significantly stimulated the fibroblasts infiltration. Figure A2–D2 are representing Masson-trichrome staining techniques for collagen deposition in dermis (DS). See the well-formed re-epithelialization in REO and REO-NLCs-treated groups compared with mupirocin-treated and control animals. See hair follicle sprouting (HF) and sebaceous glands (SG) in REO and REO-NLCs-treated cross sections. The software analyses for fibroblast distribution are represented in Figure A3–D3. See intensive fibroblast distribution in REO-NLCs-treated group (A: Control, B: Mupirocin-treated, C: REO-treated and D: REO-NLCs-treated).
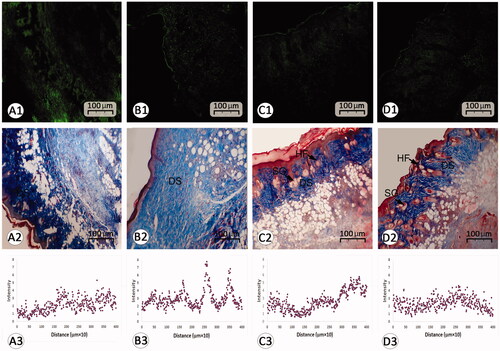
Table 3. Effect of REO and REO-NLCs gels on histological scorings on different days.
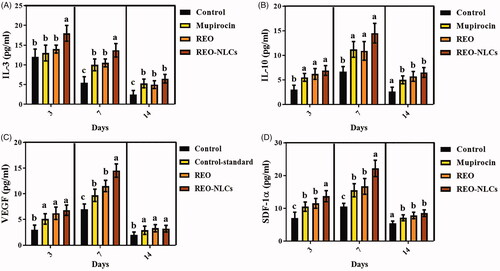
Figure 6. Effect of REO and REO-NLCs gels on IL-3 (A) IL-10 (B), VEGF (C) and SDF-1α (D) on different days. Six animals in each group. Superscripts (a–b) show significant differences between other groups and control sham.