Figures & data
Figure 1. Schematic illustration of RBC@BPQDs-DOX/KIR fabrication and application for tumour-targeted chemotherapy and anti-inflammatory therapy in mice.
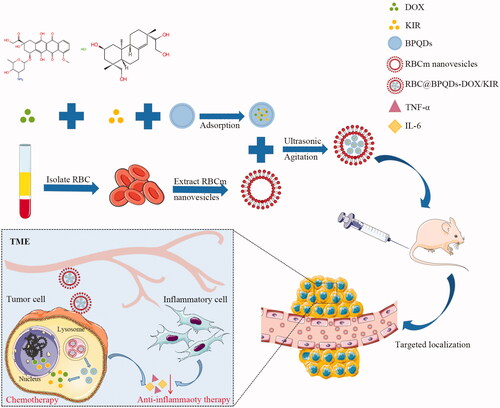
Figure 2. Characterization of the RBC@BPQDs-DOX/KIR. (A) The TEM micrographs of nanovehicles. The scale bar: 50 nm. (B) The particle size and zeta potential of BPQDs after coating with RBCm. (C) SDS-PAGE protein analysis. (D) UV–Vis spectra of BPQDs, KIR, DOX, RBCm vesicles and RBC@BPQDs-DOX/KIR. (a) BPQDs, (b) RBCm vesicles and (c) RBC@BPQDs.
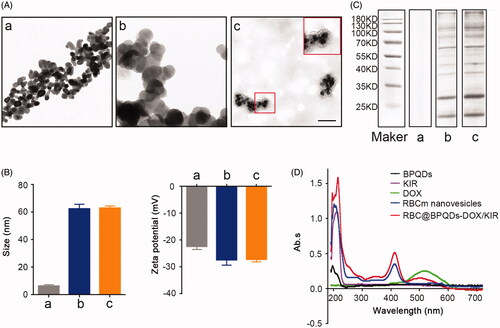
Figure 3. Drug loading and release of RBC@BPQDs-DOX/KIR. (A) EC and LE of BPQDs with DOX or KIR. The release of (B) DOX and (C) KIR from RBC@BPQDs-DOX/KIR or BPQDs-DOX/KIR at different pH (5.4, 7.4). Data are mean ± SD (n = 3). *p<.01.
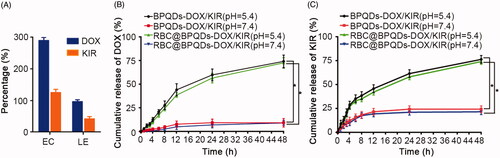
Figure 4. The biocompatibility of RBC@BPQDs-DOX/KIR. (A) CLSM micrographs of macrophages after cultured with BPQDs-RhB and RBC@BPQDs-RhB for 4 h. The scale bar: 20 μm. (B) Fluorescence intensities of collected cells after treatment with BPQDs-RhB and RBC@BPQDs-RhB, as quantified by a fluorometre. (C) Haemolysis rate of RBCs at various concentrations of BPQDs and RBC@BPQDs at 37 °C after 2 h. Data are mean ± SD (n = 3). **p<.01.
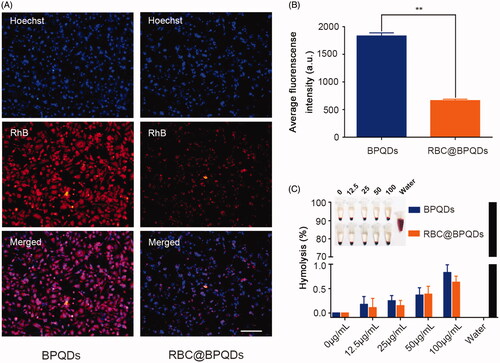
Figure 5. In vitro anti-tumour efficiency of RBC@BPQDs-DOX/KIR. (A) Cell viability and (B) analysis of apoptosis rate by flow cytometry of Hela cells treated with PBS, BPQDs, DOX, DOX + KIR, BPQDs-DOX/KIR and RBC@BPQDs-DOX/KIR at the DOX concentration of 2 μM and KIR concentration of 40 μM for 24 h. (C) The western blotting and (D) semi-quantitative analysis of Bax and Bcl-2 expression in Hela cells treated with different scheme as above for 24 h. Data are mean ± SD (n = 3). **p<.01 vs. control. ##p<.01.
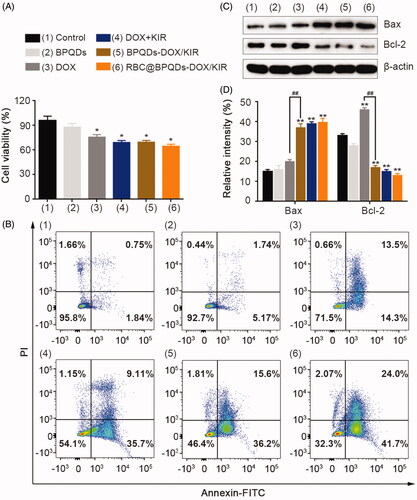
Figure 6. In vivo targeting ability of RBC@BPQDs. (A) In vivo fluorescence images of Hela xenograft model at 6 h, 24 h and 48 h after intravenous injection of cy5-labeled RBC@BPQDs and BPQDs. (B) Ex vivo bioluminescent images of the main organs and tumours at 48 h post injection. (C) Semi-quantitative analysis of fluorescence intensity from tumours and other tissues. (D) Fluorescence micrographs of tumour sections. The scale bar: 50 μm. (a) Cy5-labeled BPQDs and (b) Cy5-labeled RBC@BPQDs. 1: heart, 2: liver, 3: spleen, 4: lung, 5: kidney and 6: tumour. Data are mean ± SD (n = 3). **p<.01.
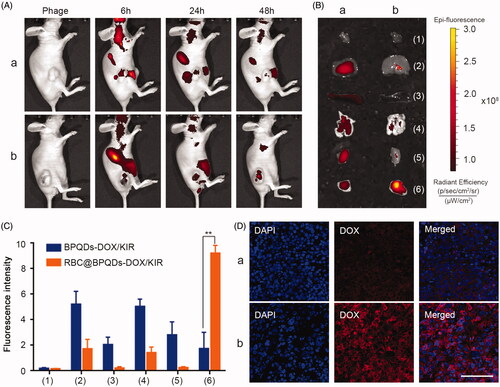
Figure 7. Anti-inflammatory effect of RBC@BPQDs-DOX/KIR. (A) The CLSM micrographs of tumour region after treated with different formulations at D14. Red: anti-IL-6, green: anti-TNF-α, blue: nucleus. The scale bar: 50 μm. (B) The western blotting test and (D) semi-quantitative analysis of the TNF-α and IL-6 expression in tumour tissues. Data are mean ± SD (n = 3). **p<.01. (Color online.)
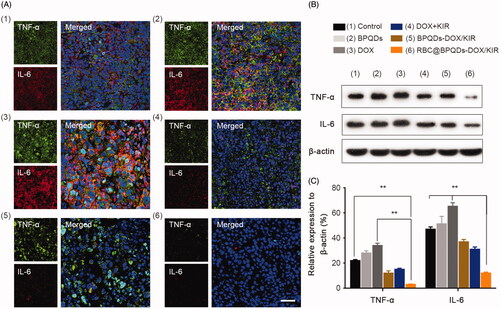
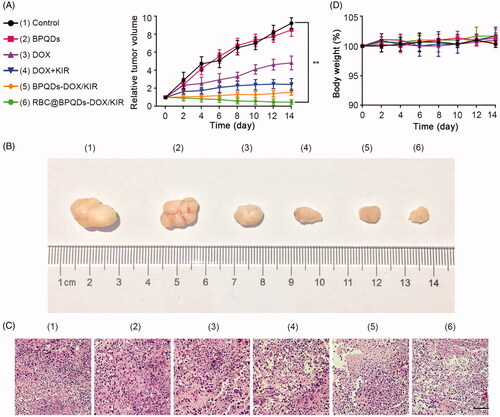
Figure 8. In vivo anti-tumour effects of RBC@BPQDs-DOX/KIR. (A) Tumour growth patterns after various treatments for 14 days. Tumour volumes were normalized to baseline values. (B) The body weight changes of Hela xenograft model during treatments were normalized to baseline values. (C) Representative images of tumours after intravenous injection of different formulations at day 14. (D) The histological observation of the tumour tissues after the treatment with different formulations stained with haematoxylin and eosin (H&E). Scale bar: 10 μm. Data are mean ± SD (n = 3). **p<.01.