Figures & data
Figure 1. Salidroside inhibited the proliferation of A549 cells. A549 cells were treated with increasing doses of salidroside (0.8, 8, 80, 800 and 8000 μM) for 48 h, and non-treated cells were acted as control. (A) Cell viability was detected by CCK-8 assay. A549 cells were stimulated with salidroside (800 μM) for 48 h, and non-treated cells were acted as control. (B) Cell colony formation was detected by staining with crystal violet. (C) mRNA expression level of Cyclin D1 was measured by qRT-PCR. (D) Protein expression levels of Cyclin D1 and p21 were determined by western blot. Data are presented as the mean ± SD of at least three independent experiments. *p < .05, **p < .01, ***p < .001.
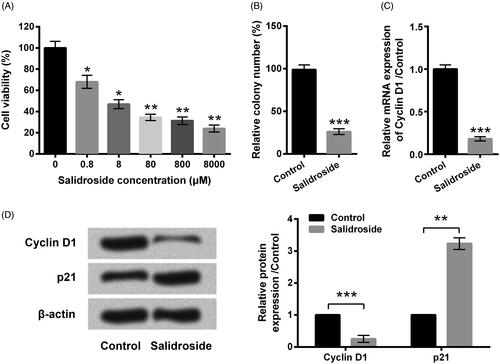
Figure 2. Salidroside promoted A549 cell apoptosis. A549 cells were stimulated with salidroside (800 μM) for 48 h, and non-treated cells acted as control. (A) Percentage of apoptotic cells was determined by flow cytometry. (B) Expression levels of apoptosis-related proteins were tested by western blot. Data are presented as the mean ± SD of at least three independent experiments. **p < .01, ***p < .001.
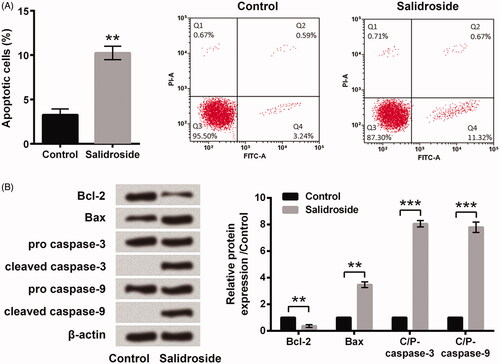
Figure 3. Salidroside inhibited the migration and invasion of A549 cells. A549 cells were stimulated with salidroside (800 μM) for 48 h, and non-treated cells acted as control. (A) Cell migration was detected by the transwell assay. (B) Expression levels of migration-related proteins were measured by western blot. (C) Cell invasion was detected by the transwell assay (with Matrigel). (D) Expression levels of invasion-related proteins were determined by western blot. Data are presented as the mean ± SD of at least three independent experiments. *p < .05.
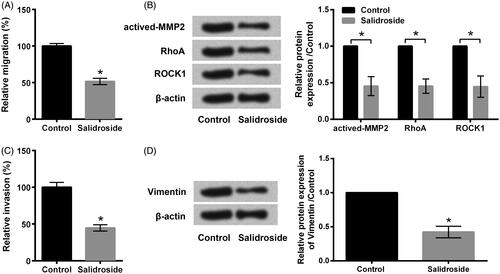
Figure 4. Salidroside deactivated AKT and the MEK/ERK signal pathway in A549 cells. A549 cells were stimulated with salidroside (800 μM) for 48 h, and non-treated cells acted as control. Phosphorylation levels of AKT, MEK and ERK were determined by western blot. Data are presented as the mean ± SD of at least three independent experiments. *p < .05.
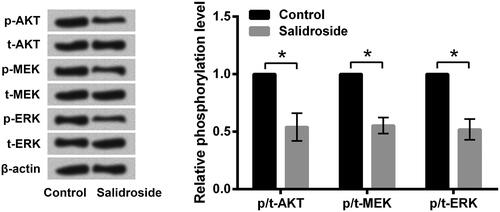
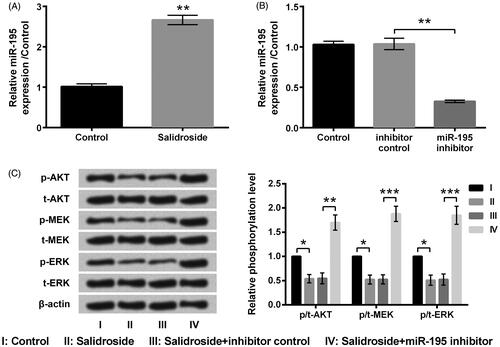
Figure 5. Salidroside deactivated AKT and the MEK/ERK signal pathway by upregulating miR-195 expression. A549 cells were stimulated with salidroside (800 μM) for 48 h, and non-treated cells acted as control. (A) Expression of miR-195 was testified by qRT-PCR. A549 cells were transfected with inhibitor control and miR-195 inhibitor, and untransfected cells acted as control. (B) Expression level of miR-195 was measured by qRT-PCR. After transfection, cells were treated with salidroside (800 μM) for 48 h. Non-treated cells were acted as control. (C) Phosphorylation levels of AKT, MEK and ERK were determined by western blot. Data are presented as the mean ± SD of at least three independent experiments. *p < .05, **p < .01, ***p < .001.