Figures & data
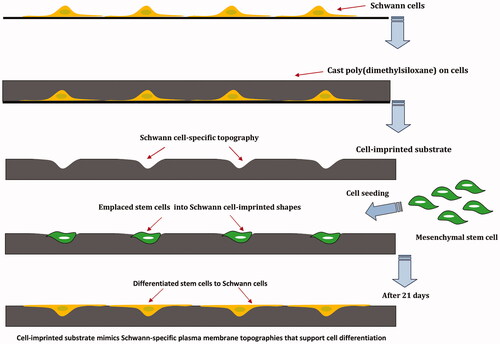
Figure 1. Schwann cells (SCs) were isolated from sciatic nerve and grown on a polystyrene culture plate. After about 10 days cells were characterized by Schwann cell-specific markers, S100β and p75NTR. After fixation, SC morphologies were transferred to PDMS by mold casting. This replica containing SC-like shape and topography and was used as a substrate. MSCs were seeded on the substrate for 3 weeks and differentiation of MSCs to SCs was evaluated.
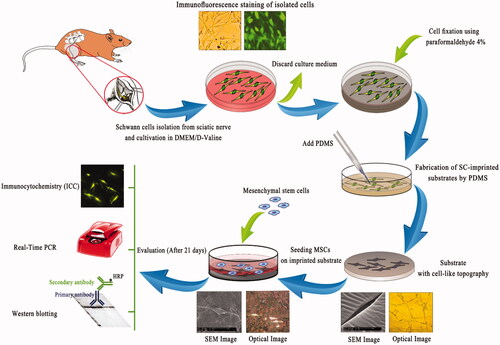
Table 1. Sequences of primers used in qualitative and quantitative PCR.
Figure 2. Schwann cells (SCs) isolated from sciatic nerve of neonatal rats using DMEM/D valine medium (A). SCs were visualized by nuclei staining with Hoechst (B), and characterized by immunocytochemistry using S100β (C) and p75NTR (D) monoclonal antibodies which were immunoreactive for markers. Similar to SCs, fibroblast cells as a negative control (E) were also visualized by nuclei staining (F) and characterized with S100β (G) and p75NTR (H) antibodies which were non-immunoreactive for these markers.
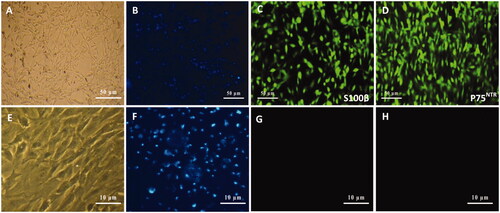
Figure 3. Optical microscopy images and SEM micrographs of SCs-imprinted PDMS substrates which biomimic SC morphology. SCs (A), optical imaging of SCs-imprinted patterns on PDMS substrate (B–F), SEM imaging of SCs-imprinted patterns on PDMS substrate (G–O). As seen in the SEM micrographs, cell templates obtained on the imprinted substrate simulate the specific topography of the SC shape.
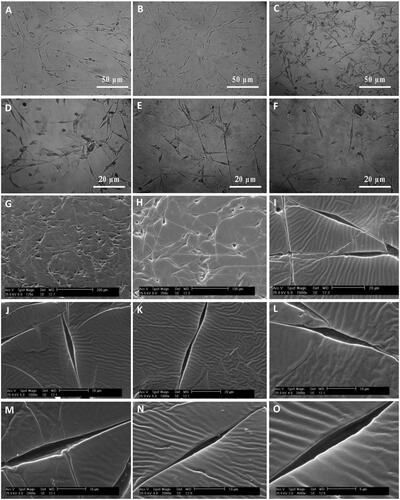
Figure 4. SEM micrographs of Schwann and adipose-derived mesenchymal stem cells cultured on culture slide. SEM micrographs showed bipolar or tripolar spindle morphology and elongated shape of SCs (A–D) compared to the flattened fibroblast-like morphology of the MSCs (E and F).
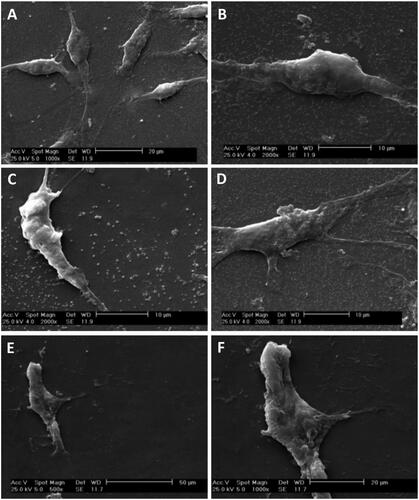
Figure 5. Optical microscopy images (A–C) and SEM micrographs (D–F) of cultivated MSCs (red arrows) on SCs-imprinted substrates after 3 weeks. During 21 days MSCs which were emplaced into the SC-imprinted patterns showed bipolar or tripolar morphology similar to Schwann cells (A–C). SEM micrographs show an emplaced MSC into SC-imprinted pattern which clearly indicates bipolar spindle morphology of SC (D–F).
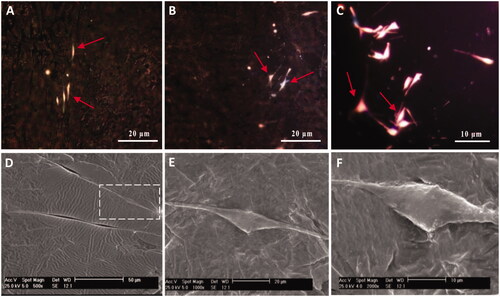
Figure 6. Characterization of cultivated MSCs on SCs-imprinted substrate by anti-S100β antibody after 3 weeks. Optical imaging (A) and fluorescence microscopy of nuclei staining (B), ICC staining (C) of some differentiated MSCs emplaced into SC-imprinted patterns. MSCs on imprinted substrates with the lower magnification were characterized by nuclei Hoechst staining (D–F) and anti-S100β antibody (G–I). Non-immunoreactive cells (undifferentiated MSCs) shown with white arrows (D-I). High magnification of differentiated SCs from MSCs (J–N). Cultivated MSCs on the plain substrate were negative for this marker (not shown).
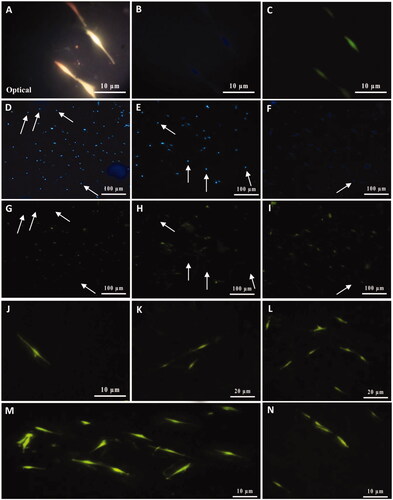
Figure 7. Characterization of cultivated MSCs on SCs-imprinted substrate by anti-p75NTR antibody after 3 weeks. Cell nuclei were stained with Hoechst (A–D) and then characterized by the anti-p75NTR antibody (E–H). Differentiated MSCs show immunoreactive for the p75NTR marker (E–H). Higher magnification of some SCs differentiated from MSCs (I–M). Similar to S100β, MSCs which cultured on the plain substrate were negative for the p75NTR marker (not shown).
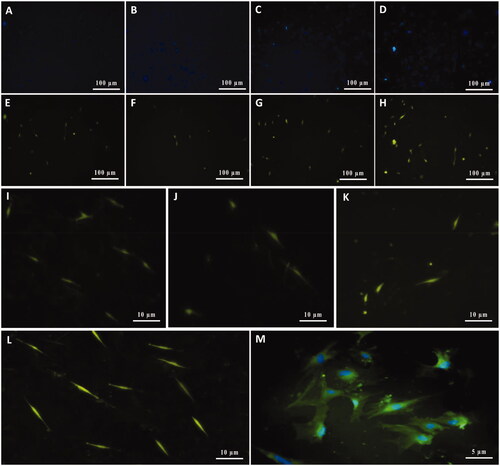
Figure 8. Qualitative (A) and quantitative (B) expression status of the SC-specific S100β, p75NTR, and Sox10 genes in cultivated MSCs on imprinted substrates (differentiated MSCs or dMSCs) after 3 weeks. The primary SCs and cultivated MSCs on plain substrates (undifferentiated MSCs or uMSC) were used as positive and negative controls, respectively. qPCR assay showed that the expression level of the Schwann markers in differentiated MSCs (dMSCs) is not significantly different from the primary SCs (*P < .01 & **P < .001). For qPCR assay, housekeeping β-actin gene was used as calibrator control. In addition, the DNA bands related to the qualitative PCR have been cropped from different gels.
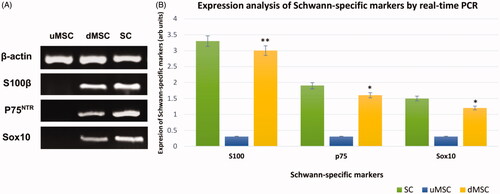
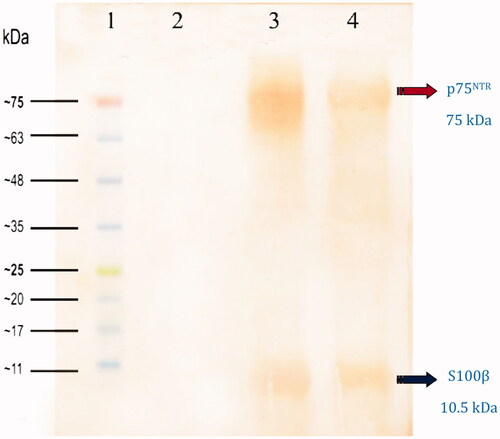
Figure 9. Western blot analysis of cultivated dMSCs on the SCs-imprinted substrates after 3 weeks. Lane 1: protein marker; Lane 2: extracted proteins from MSCs which were seeded on a plain substrate (without SC-imprinting); Lane 3: extracted proteins from primary SCs; Lanes 4: extracted proteins from dMSCs which were seeded on SCs-imprinted substrate.