Figures & data
Figure 1. Salicin treatment suppressed AGE-induced oxidative stress in human SW1353 chondrosarcoma cells. Human SW1353 cells were treated with 100 μg/ml AGEs in the presence or absence of 50 and 100 μM salicin for 48 h. (A). Intracellular ROS was determined by the DCFH-DA assay; (B). The protein carbonyl content was determined by the 2, 4-dinitrophenyl-hydrazine (DNPH) assay (a, b, c, p < .01 vs. previous column group).
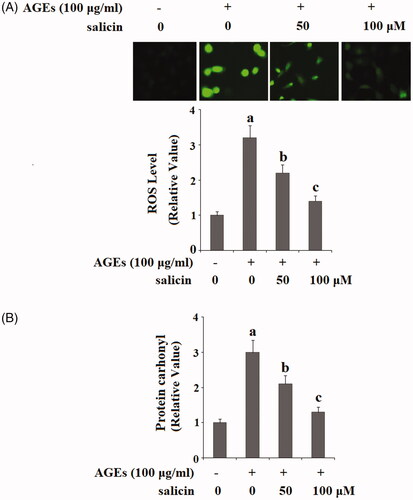
Figure 2. Salicin treatment suppressed the expression and secretions of pro-inflammatory cytokines. Human SW1353 cells were treated with 100 μg/ml AGEs in the presence or absence of 50 and 100 μM salicin for 48 h. (A). Expressions of IL-1β, TNF-α, and MCP-1 at the mRNA levels were determined by real time PCR analysis; (B). Secretion of IL-1β, TNF-α, and MCP-1 was determined by ELISA.
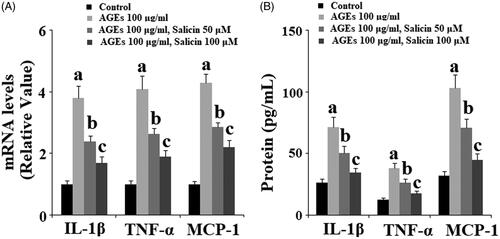
Figure 3. Salicin treatment inhibited the secretion of high-mobility group protein 1 (HMGB-1). Human SW1353 cells were treated with 100 μg/ml AGEs in the presence or absence of 50 and 100 μM salicin for 48 h. Secretion of HMGB-1 was determined by the ELISA assay (a, b, c, p < .01 vs. previous column group).
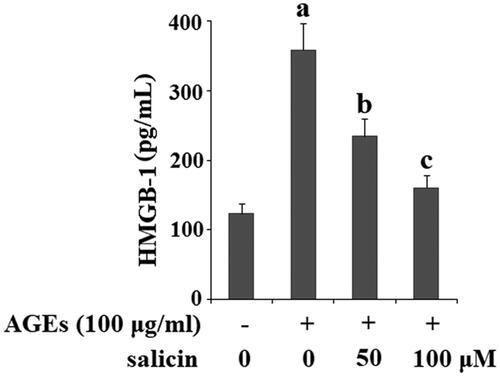
Figure 4. Salicin treatment ameliorated AGEs-induced degradation of type II collagen in human SW1353 cells. Human SW1353 cells were treated with 100 μg/ml AGEs in the presence or absence of 50 and 100 μM salicin for 48 h. Expression of type II collagen was determined by western blot analysis (a, b, c, p < .01 vs. previous column group).
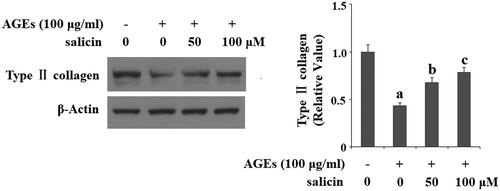
Figure 5. Salicin treatment ameliorated AGEs-induced expression of MMP-1, MMP-3, and MMP-13 in human SW1353 cells. Human SW1353 cells were treated with 100 μg/ml AGEs in the presence or absence of 50 and 100 μM salicin for 48 h. (A). Expression of MMP-1, MMP-3, and MMP-13 at the gene levels was determined by real time PCR analysis; (B). Expression of MMP-1, MMP-3, and MMP-13 at the protein levels was determined by ELISA (a, b, c, p < .01 vs. previous column group).
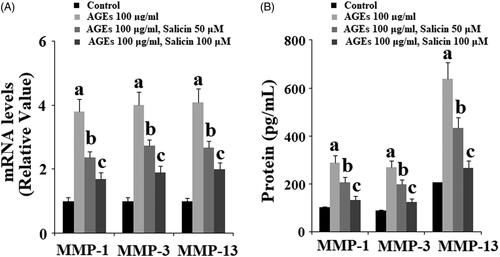
Figure 6. Salicin treatment ameliorated AGEs-induced degradation of aggrecan in human SW1353 cells. Human SW1353 cells were treated with 100 μg/ml AGEs in the presence or absence of 50 and 100 μM salicin for 48 h. Expression of Aggrecan was determined by Western blot analysis (a, b, c, p < .01 vs. previous column group).
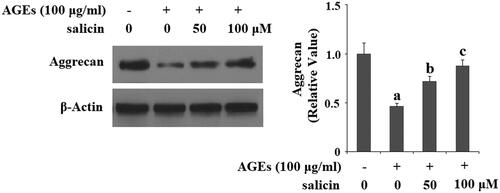
Figure 7. Salicin treatment ameliorated AGEs-induced expressions of ADAMTS-4 and ADAMTS-5 in human SW1353 cells. Human SW1353 cells were treated with 100 μg/ml AGEs in the presence or absence of 50 and 100 μM salicin for 48 h. (A). Expression of ADAMTS-4 and ADAMTS-5 at the gene levels was determined by real time PCR analysis; (B). Expression of ADAMTS-4 and ADAMTS-5 at the protein levels was determined by ELISA (a, b, c, p < .01 vs. previous column group).
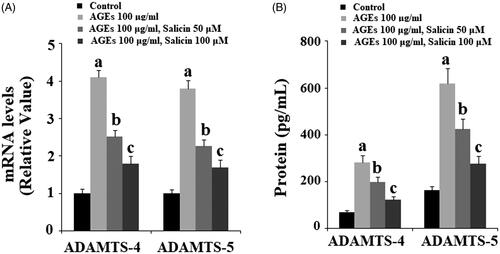
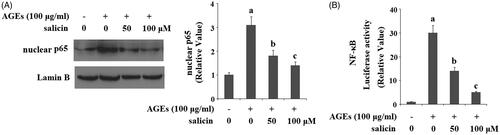
Figure 8. Salicin treatment inhibits AGEs-induced activation of NF-κB in human SW1353 cells. Human SW1353 cells were treated with 100 μg/ml AGEs in the presence or absence of 50 and 100 μM salicin for 48 h. (A). Nuclear translocation of p65; Lamin B was used as a positive control; (B). Luciferase activity of NF-κB was determined (a, b, c, p < .01 vs. previous column group).