Figures & data
Figure 1. A schematic description for synthesis a glycosylated gold nanoshell and photothermal ablation of melanoma cells under NIR laser irradiation.
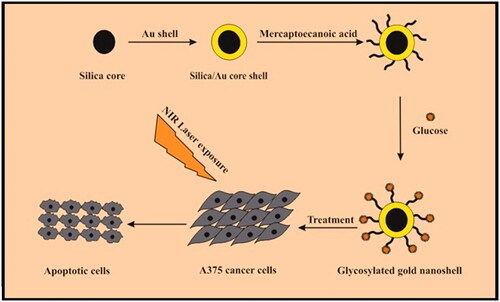
Figure 2. Schematic illustration of synthesis procedure of GNs and GGNs.
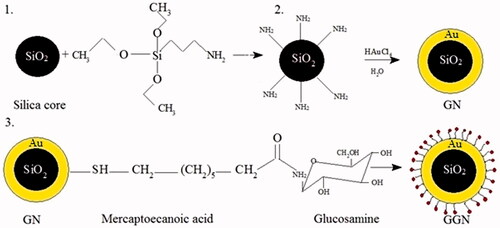
Figure 3. SEM image of GGNs.
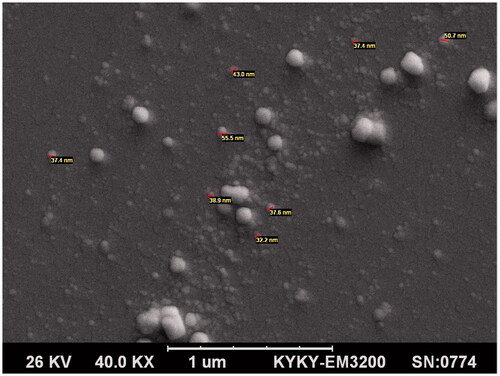
Figure 4. DLS measurment of size distribution of GGNs.
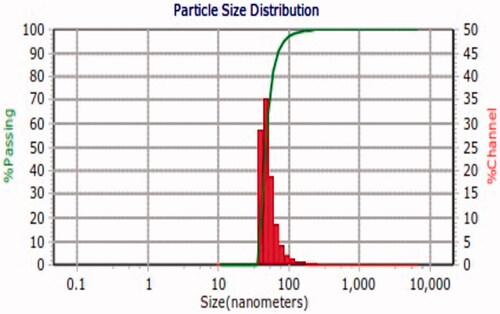
Figure 5. FT-IR spectra of silica core, GNs and GGNs.
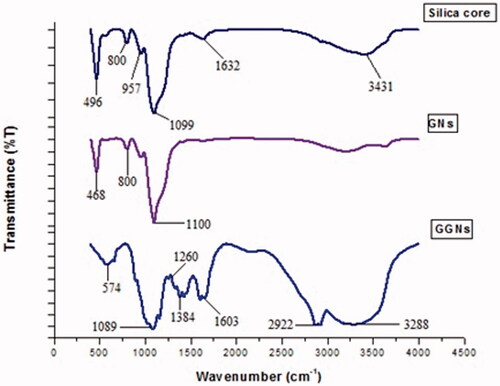
Figure 6. UV.visible spectrum of GGNs.
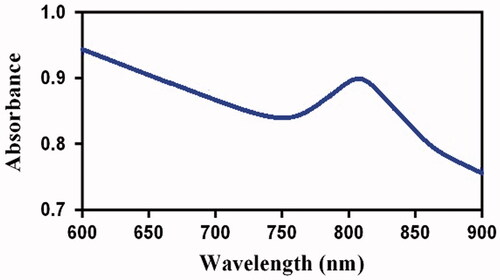
Figure 7. Intra-cellular uptake assay of GNs and GGNs. (a) Compare the uptake of GNs and GGNs in A375 cancer cells. (b) Indicate the difference of uptake of GGNs in HDF and A375 cell lines.
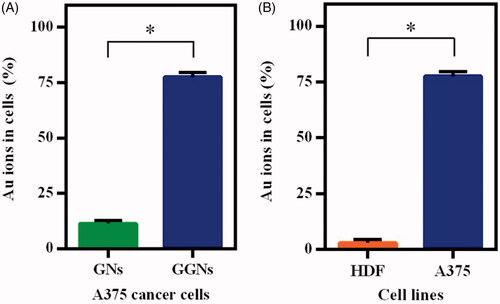
Figure 8. Cell viabilites of the (a) HDF and (b) A375 cells incubated by various concentration of GNs and GGNs for 24 h. All data represent average value of triplicate.*p Values .05, compared with control group.
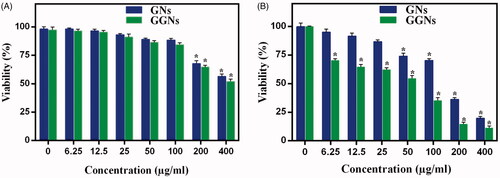
Figure 9. Photothermal effects of GGNs under the irradiation of 808 nm NIR laser in diverse times. Cell viability of A375 cells treated with NIR laser with or without incubation with 50g/ml GNs and GGNs. Data are presented as means
standard deviation.
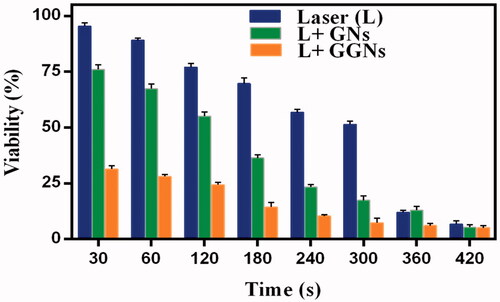
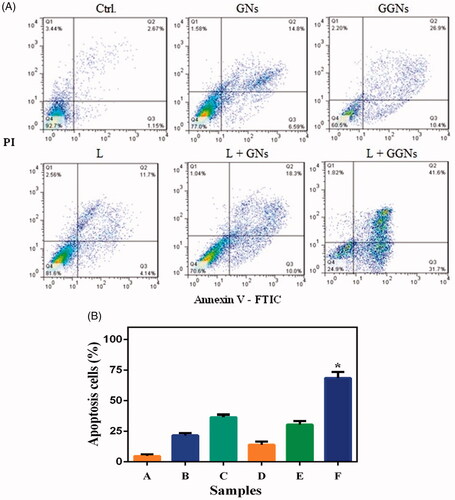
Figure 10. Flow cytometry analysis. (a) flow cytometry analysis of the A375 cells were exposed to NIR laser after incubation GNs and GGNs. (b) irradiation NIR laser in presence GGNs induce apoptosis significantly. Data are presented as the meanstandard deviation of triplicate. *p values
0.05, compared with apoptosis cells of control sample. A: ctrl; B: GNs; C:GGNs; D: laser; E: laser + GNs; F: laser + GGNs.