Figures & data
Figure 1. UV-vis spectra of soluble and immobilized βGS in the presence of investigated compounds. The spectra show (a) free (b) PANI-CS-NC-βGS and (c) PANI-CS-Ag-NC-βGS (0.06 U). The concentration of VC was 0.1 mg mL−1 and each sugar was 5% (w/v).
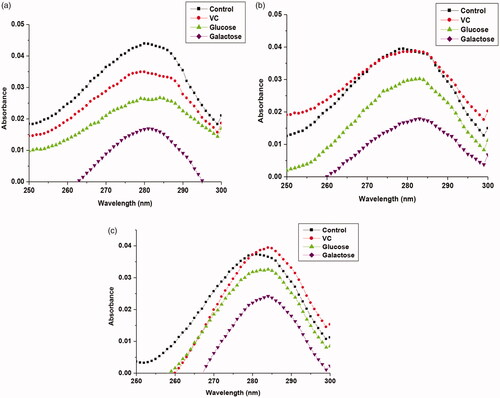
Figure 2. Fluorescence emission spectra of free and NC immobilized βGS in the presence of added compounds. The spectra illustrate (a) free (b) PANI-CS-NC-βGS and (c) PANI-CS-Ag-NC-βGS. The concentration of VC was 0.1 mg mL−1 and each sugar was 5% (w/v).
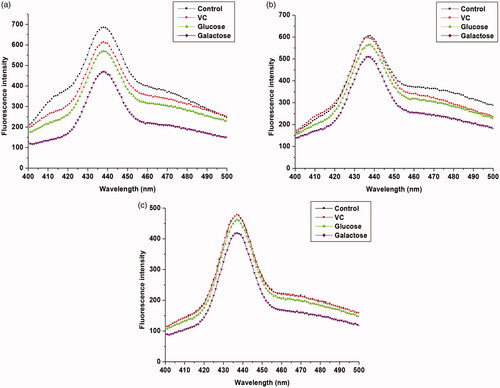
Figure 3. 3D fluorescence spectra and corresponding contour map of soluble and immobilized βGS in presence of VC. The spectra illustrate (a), (b) and (c) for controls of soluble, PANI-CS-NC-βGS, and PANI-CS-Ag-NC- βGS and (a′), (b′) and (c′) for native, PANI-CS-NC-βGS, and PANI-CS-Ag-NC-βGS treated with VC.
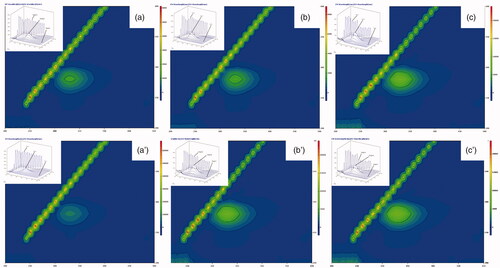
Figure 4. 3D fluorescence spectra and corresponding contour map of soluble and immobilized βGS in presence of glucose. The spectra show (a), (b) and (c) for controls of soluble, PANI/CS-NC-βGS and PANI-CS-Ag-NC-βGS and (a′), (b′) and (c′) for native, PANI/CS-NC-βGS, and PANI-CS-Ag-NC-βGS.
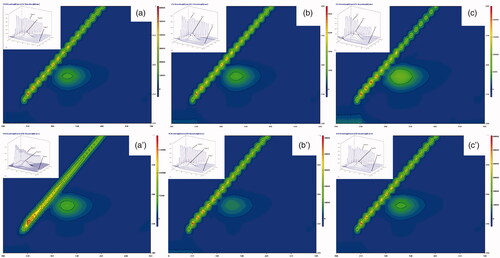
Figure 5. 3D fluorescence spectra and corresponding contour map for soluble and immobilized βGS in the presence of galactose. The spectra demonstrate (a), (b) and (c) as controls of soluble, PANI-CS-NC-βGS and PANI-CS/Ag-NC-βGS and (a′), (b′) and (c′) for native, PANI-CS-NC-βGS, and PANI-CS/Ag-NC-βGS.
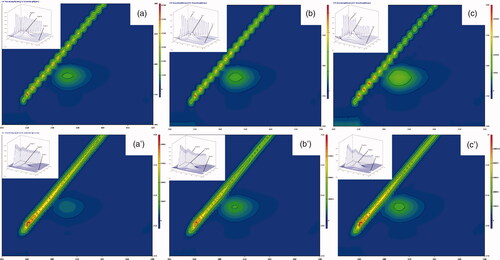
Figure 6. FT-IR spectra of soluble and NC immobilized βGS in the presence of VC and sugars. The spectra depict (a) free (b) PANI-CS-NC-βGS and (c) PANI-CS-Ag-NC-βGS.
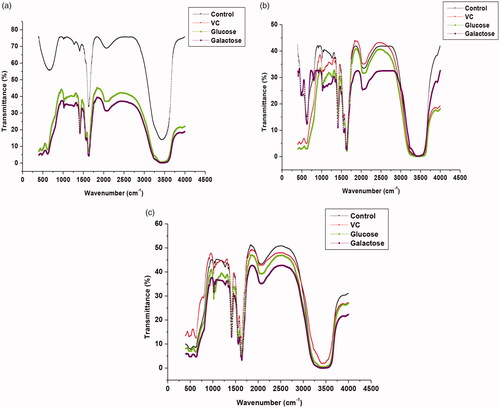
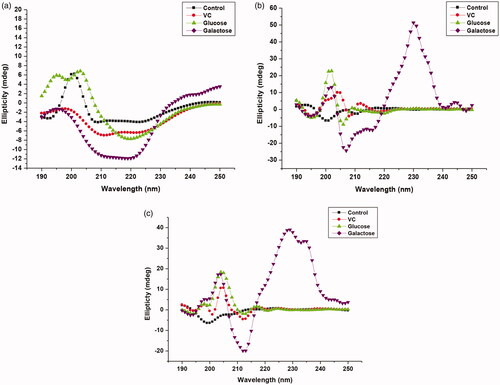
Figure 7. CD spectra of native and immobilized βGS in the presence of added compounds. The spectra illustrate (a) free (b) PANI/CS-NC-βGS and (c) PANI-CS-Ag-NC-βGS.