Figures & data
Figure 1. Transmission electron microscopy of U-CH NP (A), (B) U-FA-CH NP, (C) atomic force microscopy of U-CH NP and (D) U-FA-CH NP.
![Figure 1. Transmission electron microscopy of U-CH NP (A), (B) U-FA-CH NP, (C) atomic force microscopy of U-CH NP and (D) U-FA-CH NP.](/cms/asset/8e6eea14-3d35-4259-986d-86a032c0319d/ianb_a_1593848_f0001_c.jpg)
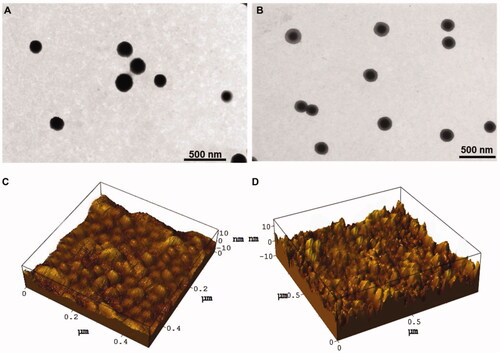
Table1. Particle size, zeta potential and entrapment efficiency (EE %) of U-CH-NP and U-FA-CH-NP.
Figure 2. (A) Caspase 3 colorimetric assay. Significant differences were observed as compared to control (*p < .01), (B) percentage of cells in various phases of cell cycle 2 h and 12 h post treatment, (C) DNA Cell cycle analysis, Cells (in percentage) at G1, S, G2 phases of cell cycle and apoptosis at 2h and 12 h post-treatment, and (D) percentage cell viability of different formulations in Caco-2 cells.
![Figure 2. (A) Caspase 3 colorimetric assay. Significant differences were observed as compared to control (*p < .01), (B) percentage of cells in various phases of cell cycle 2 h and 12 h post treatment, (C) DNA Cell cycle analysis, Cells (in percentage) at G1, S, G2 phases of cell cycle and apoptosis at 2h and 12 h post-treatment, and (D) percentage cell viability of different formulations in Caco-2 cells.](/cms/asset/40ce0562-5264-484d-8ce8-ecb0b8532554/ianb_a_1593848_f0002_c.jpg)
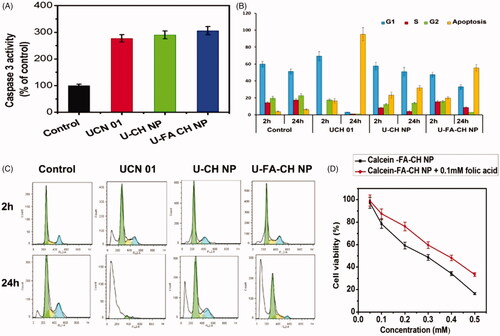
Table 2. IC50 Values of different formulation on Caco-2 cells.
Figure 3. In Vivo distribution profiles of various formulations at different time intervals. (A) Tumor drug concentrations after oral administration of different formulations, (B) effect of free UCN 01 and various nanoparticle formulations on tumor growth in mice as compared to control, (C) Kaplan–Meir survival plot, (D) histopathology of stomach, small intestine and colon 10 h after formulation administration and (E) stability assessment of U-CH NP and U-FA-CH NP.
![Figure 3. In Vivo distribution profiles of various formulations at different time intervals. (A) Tumor drug concentrations after oral administration of different formulations, (B) effect of free UCN 01 and various nanoparticle formulations on tumor growth in mice as compared to control, (C) Kaplan–Meir survival plot, (D) histopathology of stomach, small intestine and colon 10 h after formulation administration and (E) stability assessment of U-CH NP and U-FA-CH NP.](/cms/asset/f63c01ac-e933-4b65-a142-83f9ce022d59/ianb_a_1593848_f0003_c.jpg)
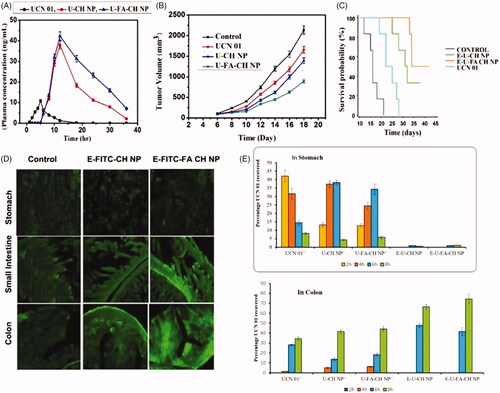
Table 3. Tumor distribution profile.