Figures & data
Figure 1. In vivo model: (A) Removal of cranial bone, (B) implantation of scaffold, (C) injection of stem cell suspension.
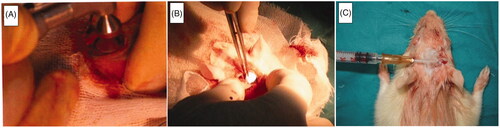
Table 1. Tissue response scores.
Figure 2. (A) Macroscopical image of PCL membrane, (B) SEM image showing the macrochannels of the spiral wounded scaffold, (C) SEM image showing the nanofibrous structure of the PCL scaffold.
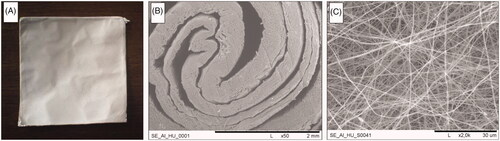
Figure 3. Representative photomicrographs of the scaffold-stem cell groups demonstrating the defect area surrounded by compact bone. Left column (A, D), middle column (B, E) and right column (C, F) show 30, 90 and 180 days, respectively. F inset shows the bone spicule (indicated by a star) at the center of the cavity. CB: Compact bone; NB: New bone; BD: Connective tissue; S: Scaffold; Bv: Blood vessel; HE: Haematoxylin & Eosin; MT: Masson’s Trichrome.
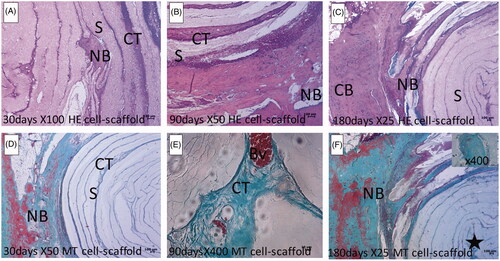
Figure 4. (A) New bone per total defect area ratio, (B) new blood vessel number, (C) osteoblast lining, (D) tissue response scores.
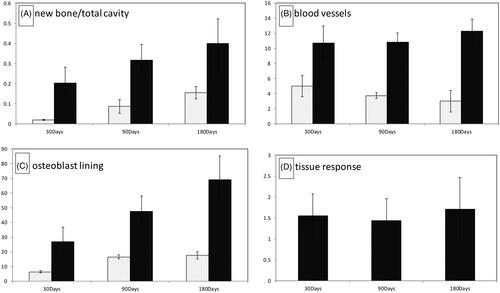
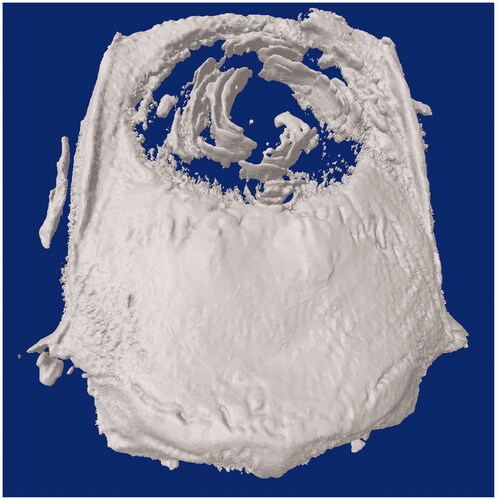
Table 2. MicroCT results.
Figure 5. A representative microCT image of cell–scaffold samples on day 180.