Figures & data
Figure 1. UV–visible spectrum absorption pattern and Dynamic Light Scattering of gold nanoparticles synthesized from Panax notoginseng. (A) UV-visible absorption spectrum of synthesized AuNPs. (B) Dynamic light scattering (DLS) images of AuNPs synthesized from Panax notoginseng and the size of the nanoparticles is 128 nm.
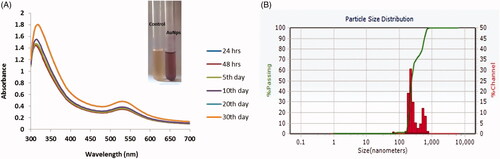
Figure 2. HR-Transmission electron microscopy (HR-TEM) and energy-dispersive X-ray analysis (EDX) of gold nanoparticles synthesised from Panax notoginseng. (A) Transmission electron microscopy (HR-TEM) and (B) Energy-dispersive X-ray (EDX) and analysis AuNPs synthesised from Panax notoginseng.
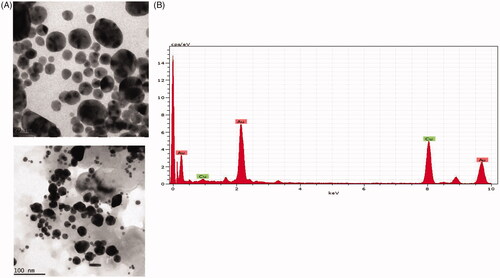
Figure 3. Atomic force microscopy analysis of gold nanoparticles synthesized from Panax notoginseng.
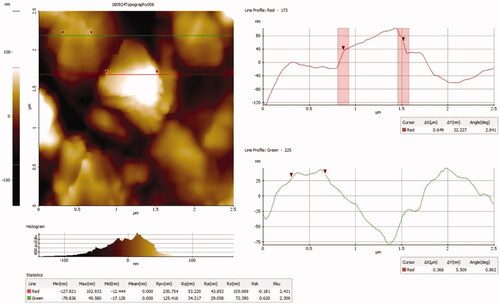
Figure 4. Fourier transform infrared (FTIR) spectroscopy analysis of AuNPs synthesized from Panax notoginseng.
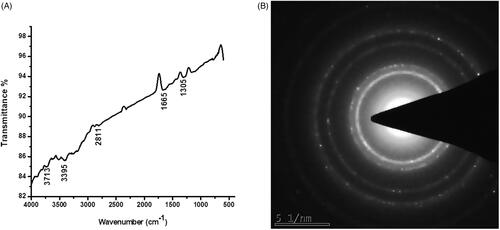
Figure 5. Cytotoxic potential and ROS measurements of AuNPs from Panax notoginseng in PANC-1 cells.
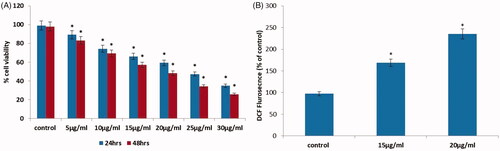
Figure 6. AuNPs mediated apoptotic morphological studied by AO/EtBr staining in PANC-1 cells.
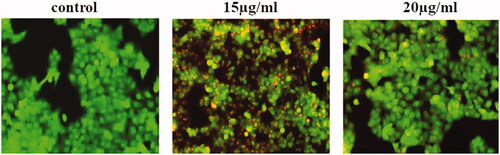
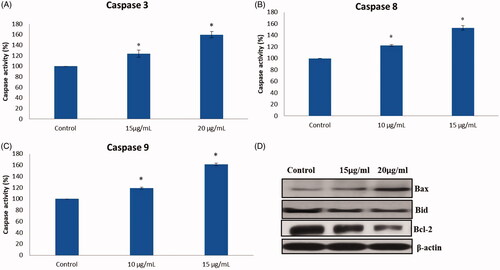
Figure 7. (A–C) Colorimetric assay for caspase-8, 9 & 3 activity expression in AuNPs treated PANC-1 cells. (D) Western blotting images for Bax, Bcl-xl, Bcl-2 and caspase-3 protein expression in AuNPs treated PANC-1 cells.