Figures & data
Table 1. Primes used in qRT-PCR.
Figure 1. Relative expression of β-catenin, Wnt3, Wnt10a, Cyclin D1 and MMP-13 in different OA grade. Relative expression of Cyclin D1 decreased by grade of OA (A). Relative expression of β-catenin (B), Wnt3 (C) and MMP-13 (E), increased by grade of OA. No significant difference in Wnt10a between the different OA grade (D). Western blot analysis over the expression of these proteins by grade of OA (F).
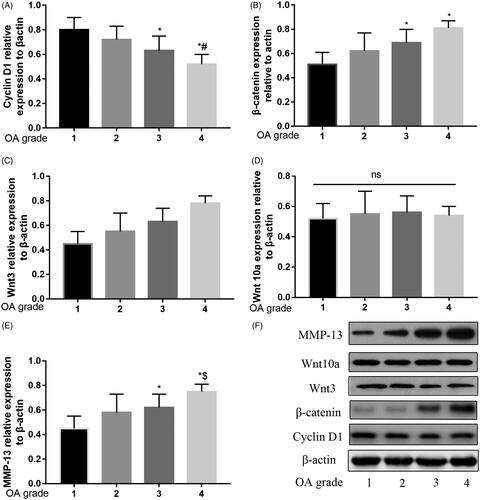
Figure 2. The relative expression of protein of Cyclin D1 was decreased when infection with siRNA and increased when over-expression with Cyclin D1 (A,B); the relative expression of mRNA of Cyclin D1 was decreased when infected with siRNA and increased when overexpressed with Cyclin D1 (C); cell activity was up-regulated in Cyclin D1 group than control group and siCyclin D1 group (D); flow cytometry analysis of control (E); siRNA (F) and over-expression (G) with Cyclin D1. Statistical chart for apoptosis ratio for these groups (H).
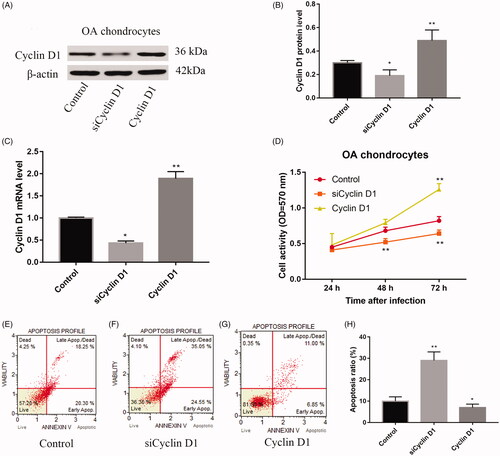
Figure 3. The relative expression of Wnt3 (A), nuclear β-catenin (B) and total β-catenin RNA (C) in a control group, siCyclin D1 and Cyclin D1 groups. Compared with control group, siCyclin D1 could promote the expression of Wnt3 and nuclear β-catenin.
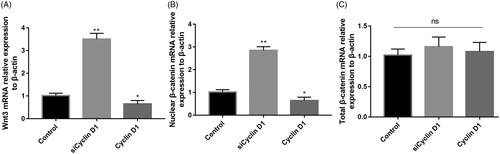
Figure 4. Representative image of Western blot for the expression of Wnt3, nuclear β-catenin and total β-catenin (A); Compared with control group, siCyclin D1 could increase the expression of Wnt3 (B) and nuclear β-catenin (C). No significant difference was found between the total β-catenin expression (D).
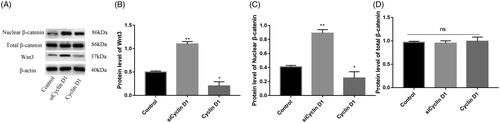
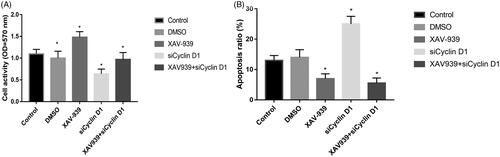
Figure 5. OA chondrocytes proliferation (A) and apoptosis ratio (B) in different groups.