Figures & data
Figure 1. PL emission spectra and absorption, of CDs.
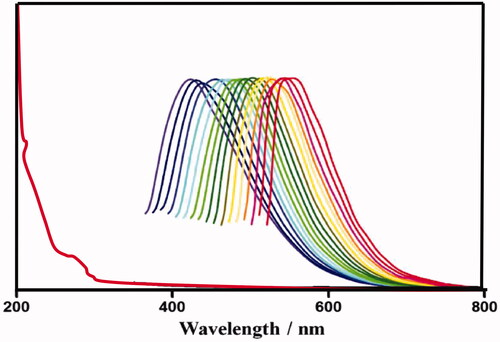
Figure 2. Raman spectrum of prepared carbon dots.
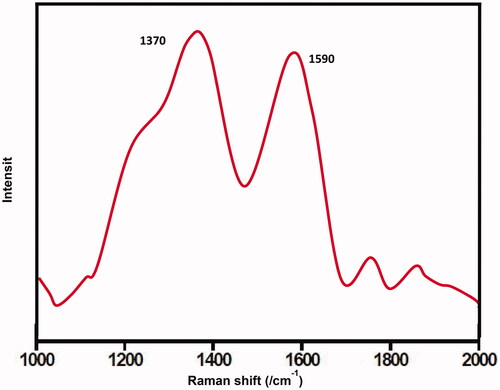
Figure 3. FTIR spectra of carbon dots (red) and plant extract (blue).
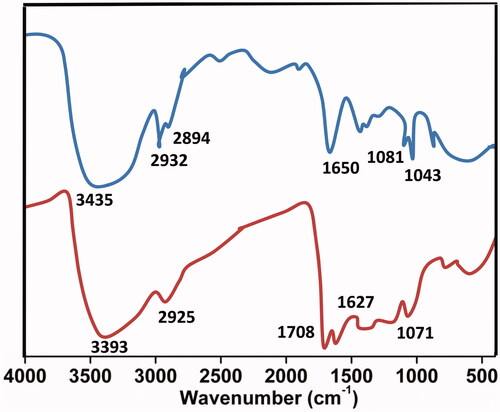
Figure 4. X-ray diffraction of plant extract mediated CDs.
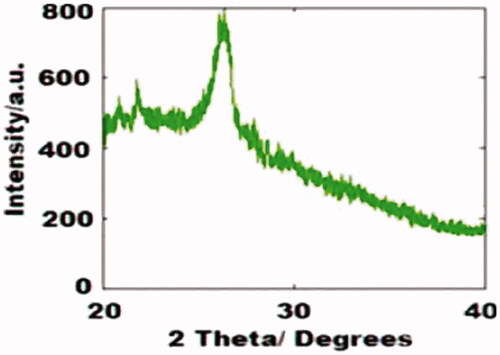
Figure 5. HR-TEM morphological images of fabricated CDs.
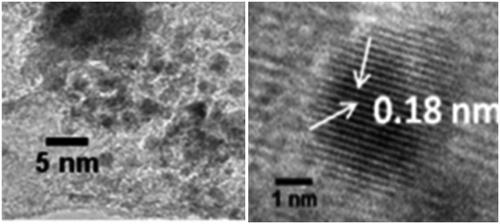
Figure 6. Synovial inflammation induced by CDs stimulation in knee joints.
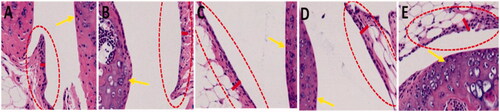
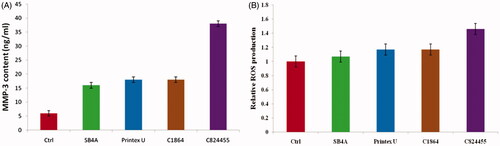
Figure 7. (A) Cell viability induced by CDs towards SW-1353 chondrocytes. (B) The production of ROS after treatment with CDs against SW-1353 cells.
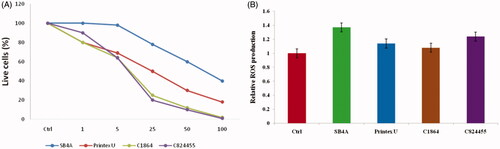
Figure 8. MMP-3 mRNA expression levels. (A) MMP-3 protein content in supernatant; (B) of SW-1353 chondrocytes.