
Figures & data
Table 1. Physicochemical properties of some formulations.
Table 2. Spectral numbers of each substance and Rif-SLNs.
Table 3. Rif-SLNs dispersion stability trend in different times and temperatures based on size, PDI, ZP and appearance form.
Figure 1. Size and PDI optimum formulation (F10).
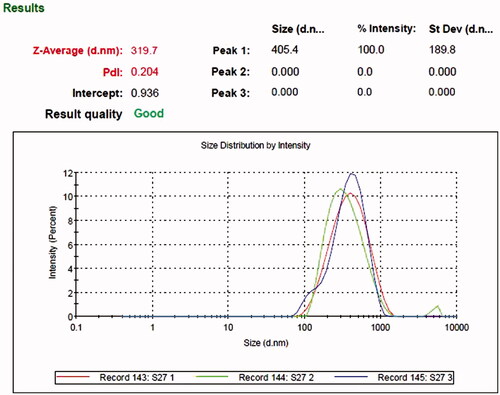
Figure 2. ZP of optimum formulation (F10).
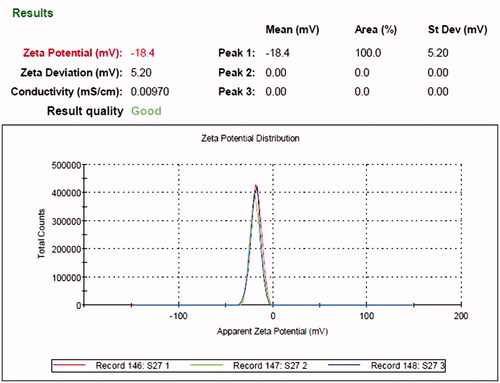
Figure 3. Agar Well Diffusion test on B. abortus 544; Rif- SLNs (A–C), free Rifampicin (D,E), Blank SLN (C–F) and Rifampicin 5-μg disk (C).
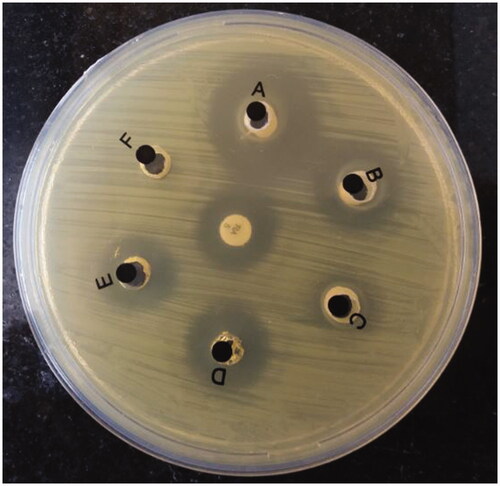
Figure 4. Rifampicin standard internal curve.
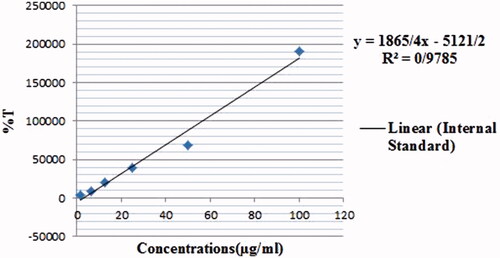
Figure 5. Retention time of Rif-SLNs peak.
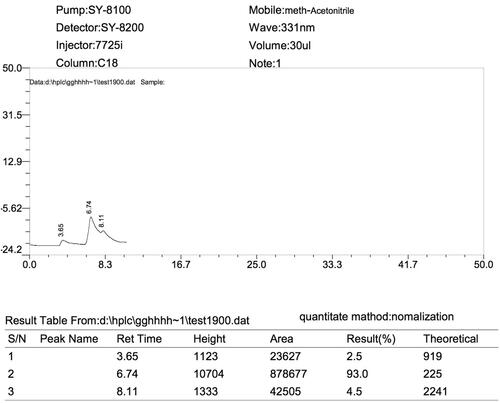
Figure 6. Rif-SLNs thermograms and its constituent ingredients.
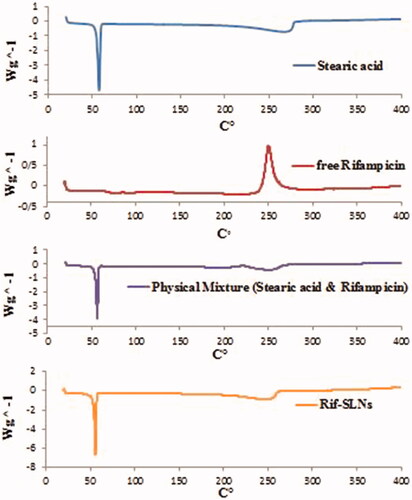
Figure 7. Comparison of spectral numbers of raw materials with Rif-SLNs.
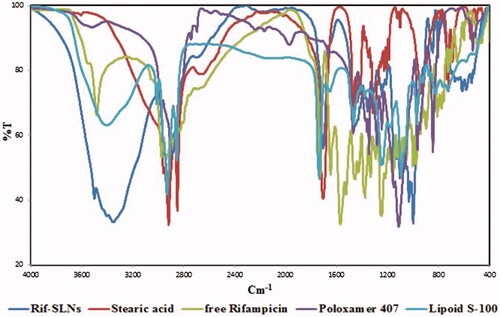
Figure 8. Image of Rif-SLNs electron microscope.
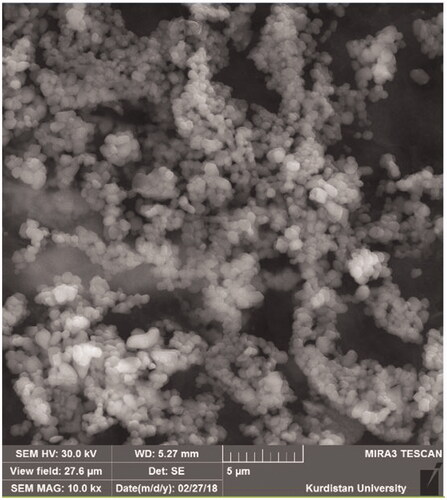
Figure 9. Release test of Rif-SLNs and free Rifampicin.
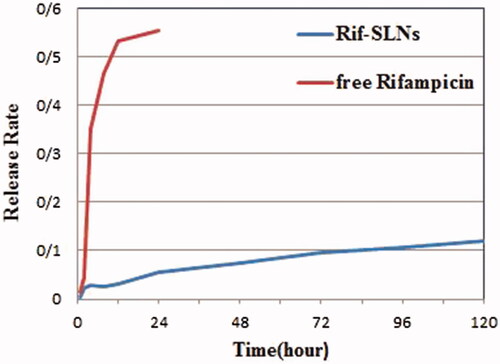
Figure 10. Toxicity test of Rif-SLNs.
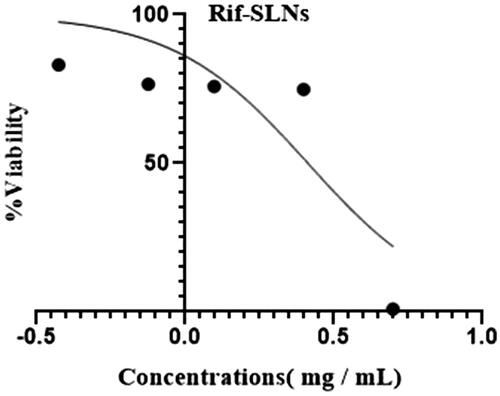
Figure 11. Toxicity test of free Rifampicin.
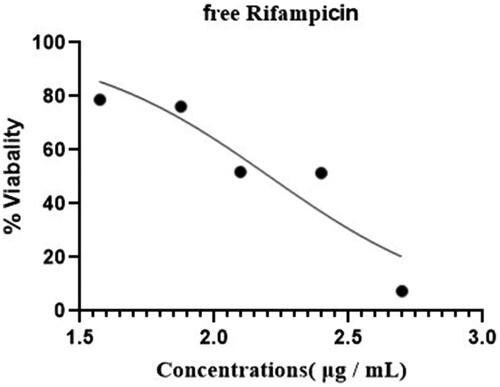
Figure 12. The effect comparison of free Rifampicin and Rif-SLNs on J774 A(0).1 infected with B. abortus 544.
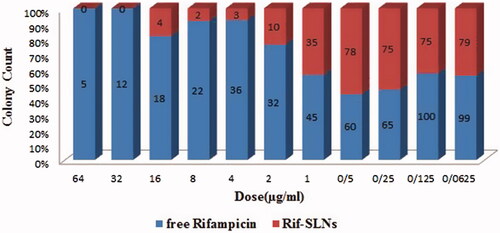
Figure 13. Free Rifampicin MIC after 24 h (A) and 72 h (B).
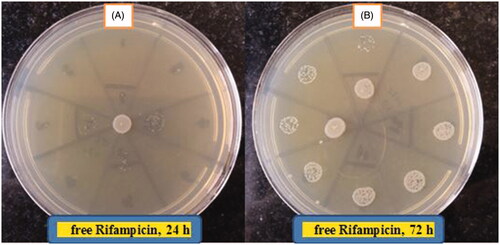
Figure 14. Rif-SLNS MIC after 24 h (C) and 72 h (D).
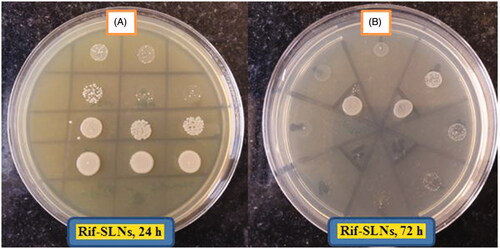
Table 4. Comparing results at different times (24, 48 and 72 h) in two groups (free Rifampicin and Rif-SLNs).
Table 5. Variations process at different times (24, 48 and 72 h) in two groups (free Rifampicin and Rif-SLNs).