
Figures & data
Figure 1. Irradiation set-up of microplates. The cells were seeded with two wells spaced apart.
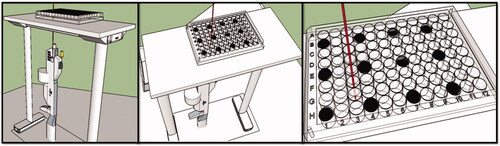
Figure 2. UV/VIS absorption spectrum of MWCNTs-COOH using a duplex atomic absorption spectrophotometer (a) and SEM image of MWCNTs-COOH particles (b).
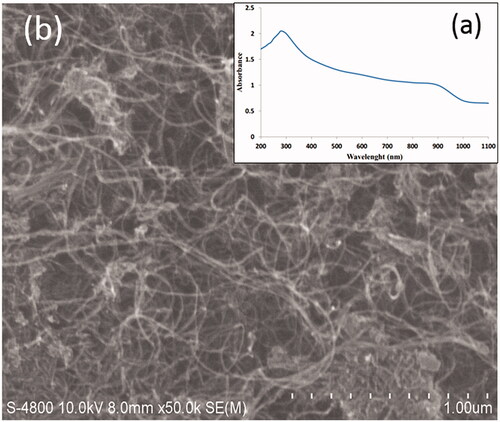
Figure 3. Size distribution curve (a) and Zeta potential distribution curve (b) of MWCNTs-COOH by particle size analyzer (PSA, Zetasizer, Malvem, UK).
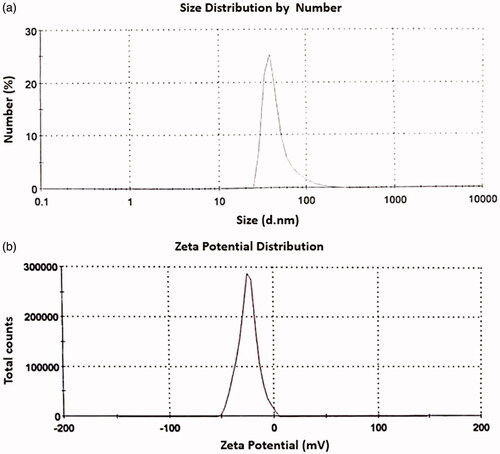
Figure 4. The temperature fluctuations of MWCNT-COOH suspension at various concentrations against three power levels (1.5, 2, and 2.5 watts) upon 20 s irradiation time. Temperature was measured by thermometer (Triplicate).
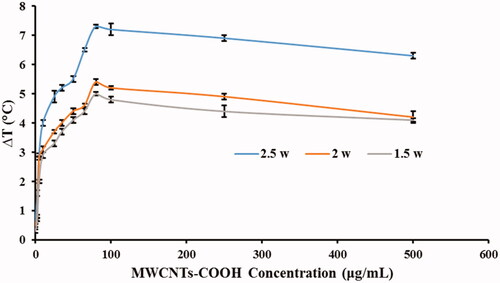
Figure 5. CT26 cells viability (%) for determination of MWCNTs-COOH cytotoxicity was measured by MTT assay. Percent of toxicity = (ODtest/ODcontrol) × 100. The experiments were repeated three times.
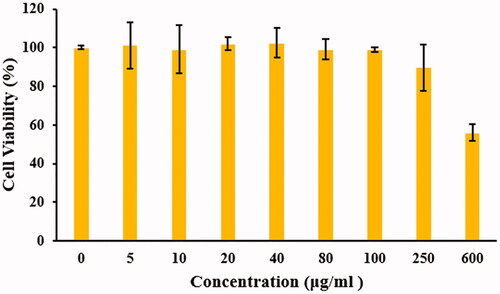
Figure 6. Mean cell viability (%) of the CT26 cells treated with different concentrations of MWCNTS-COOH particles against laser radiation. The subgroups were compared to the 0 μg/mL (control) in each group by Tukey test.
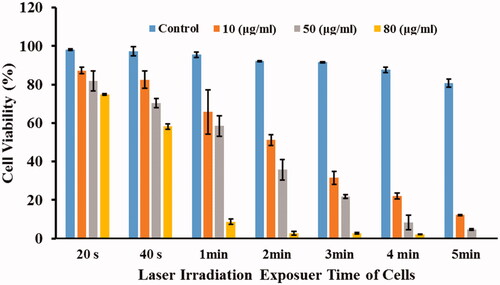
Figure 7. Mean cell viability (%) of the CT26 cells treated with different concentrations of MWCNTS-COOH particles against laser radiation. The subgroups were compared to the 20 s in each group by Tukey test.
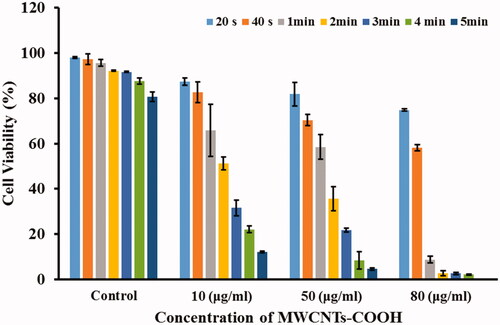
Table 1. Results of comparison of the mean cell viability (%) between different irradiation times at the specific concentration of MWCNTs-COOH using t-test.
Table 2. Results of comparison of the mean cell viability (%) between different concentrations of MWCNTs-COOH at the specific irradiation time using t-test.