Figures & data
Table 1. Correlation between relative has_circ_0051240 expression and clinicopathological characteristics of ovarian cancer patients (dCt).
Figure 1. Identification of hsa_circ_0051240 in OC. (A) The cluster heat map of Top 5 upregulated and Top 5 downregulated circRNAs in adjacent normal tissues (n = 10) and OC tissues (n = 10). Green represents low expression; red represents high expression. Individual tissue is described as a column. (B) The fold changes (C/N) of Top 5 upregulated and Top 5 downregulated circRNAs were shown. C: OC tissue; N: adjacent normal tissue. (C) The schematic diagram alternative splicing isoforms. Convergent primers detected CEACAM5 mRNA, divergent primers detected hsa_circ_0051240. (D) Sanger sequencing verified head-to-tail splicing.
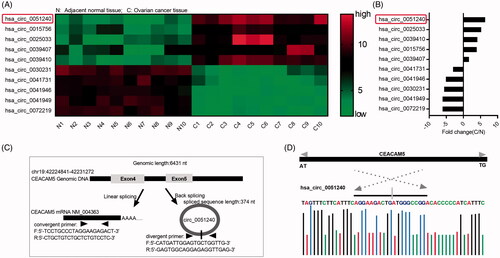
Figure 2. High expression of hsa_circ_0051240 in OC. (A) Relative expression level of hsa_circ_0051240 was accessed by qRT-PCR assay in adjacent normal tissues (n = 33) and OC tissues (n = 33) (***p < .001). (B) Hsa_circ_0051240 expression was measured by qRT-PCR assay in non-metastasis (n = 19) and metastasis (n = 14) (***p < .001). (C) Relative expression level of hsa_circ_0051240 in 33 cases of OC patients (log2 scale). (D) Hsa_circ_0051240 expression was analyzed by qRT-PCR assay in human ovarian epithelial (HOSE) cells and OC cells (CAOV-3, SKOV-3, OVCAR-3 and H8910) (*p < .05, ***p < .001). (E) Based on hsa_circ_0051240 expression, the overall survival of OC patients was analyzed by Kaplan-Meier analysis (p < .05).
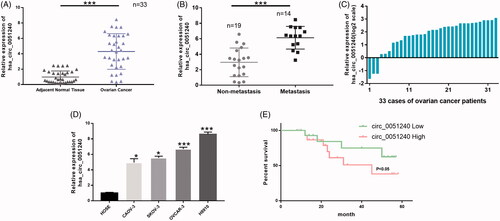
Figure 3. Silence of hsa_circ_0051240 inhibits OC cell proliferation. H8910 and OVCAR-3 cells were transfected with negative control (si-NC) and hsa_circ_0051240 siRNAs (si-circ_0051240), respectively. (A, B) qRT-PCR assay was performed to evaluate hsa_circ_0051240 expression (*p < .05). (C, D) CCK-8 assay was performed to measure the proliferation abilities of H8910 and OVCAR-3 cells (*p < .05). (E, F) Clone formation assay was used to detect the colony-formation abilities of H8910 and OVCAR-3 cells (*p < .05).
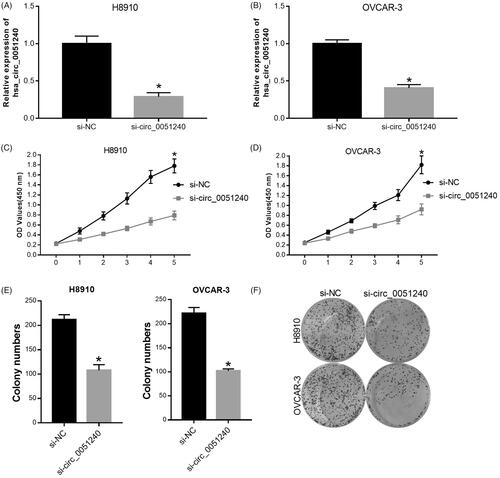
Figure 4. Silence of hsa_circ_0051240 suppresses OC cell migration and invasion. H8910 and OVCAR-3 cells were transfected with si-NC and si-circ_0051240, respectively. (A–C) The migration capacity was tested by Transwell assay (*p < .05). (D–F) The invasion capacity was measured by Transwell assay (*p < .05).
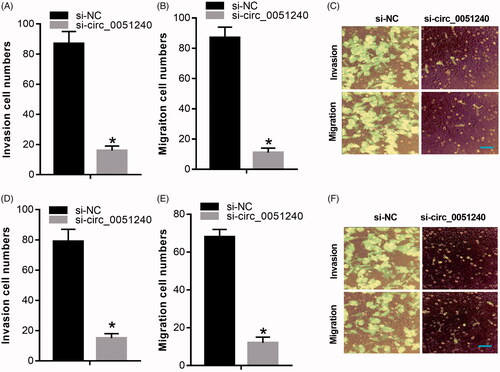
Figure 5. Hsa_circ_0051240 negatively regulates miR-637. (A) The binding sites of miR-637 and the wild-type and mutated hsa_circ_0051240 were shown. (B, C) H8910 and OVCAR-3 cells were co-transfected with miR-637 or scramble, and wild-type or mutated hsa_circ_0051240, respectively. The luciferase intensity was measured by the Dual-Luciferase Reporter Assay (*p < .05). (D) miR-637 expression was estimated by qRT-PCR assay in H8910 and OVCAR-3 cells transfected with si-NC and si-circ_0051240 (*p < .05). (E, F) H8910 and OVCAR-3 cells were treated with bio-scramble, bio- miR-637, and mutant bio-miR-637, and binding of hsa_circ_0051240 and miR-637 was accessed by pull-down assay (***p < .001).
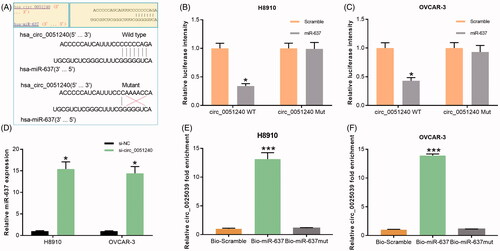
Table 2. miRNAs That predicted interacted with has_circ_0051240 by circular RNA interactome.
Figure 6. Silence of hsa_circ_0051240 inhibits OC cell proliferation, migration, and invasion by miR-637. (A) miR-637 expression was evaluated by qRT-PCR assay in adjacent normal tissues (n = 33) and OC tissues (n = 33) (***p < .001). (B) miR-637 expression was analyzed by qRT-PCR assay in HOSE, CAOV-3, SKOV-3, OVCAR-3 and H8910 cells (*p < .05, ***p < .001). (C) The correlation coefficient between hsa_circ_0051240 and miR-637 expression was analyzed by Pearson’s correlation algorithm (r = −0.8193, p < .05). (D, E) The colony-formation abilities were detected by colony formation assay in H8910 and OVCAR-3 cells transfected with si-circ_0051240 or miR-637 inhibitor as indicated (*p < .05). (F, G) the migration and invasion abilities were detected by Transwell assay in H8910 and OVCAR-3 cells transfected with si-circ_0051240 or miR-637 inhibitor as indicated (*p < .05).
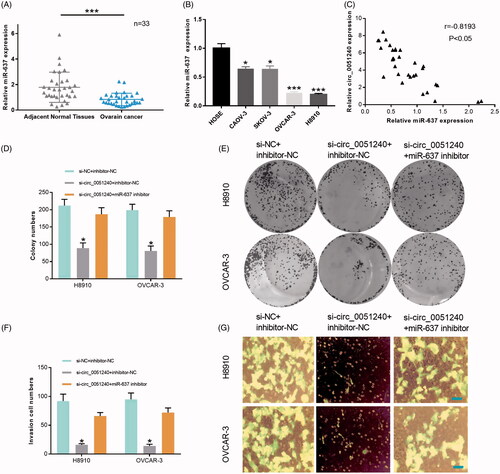
Figure 7. miR-637 negatively regulates KLK4. (A) The binding sites of miR-637 and the wild-type and mutated KLK4 were shown. (B) H8910 and OVCAR-3 cells were co-transfected with miR-637 or scramble, and wild-type or mutated KLK4, respectively. The luciferase intensity was measured by the Dual-Luciferase Reporter Assay (*p < .05). (C) KLK4 expression was measured by qRT-PCR assay in H8910 and OVCAR-3 cells transfected with scramble and miR-637 (*p < .05). (D) KLK4 expression was tested by qRT-PCR assay in adjacent normal tissues (n = 33) and OC tissues (n = 33) (***p < .001). (E) Pearson’s correlation algorithm was used to analyze the correlation coefficient between the expression of miR-637 and KLK4 (r = −0.6677, p < .05).
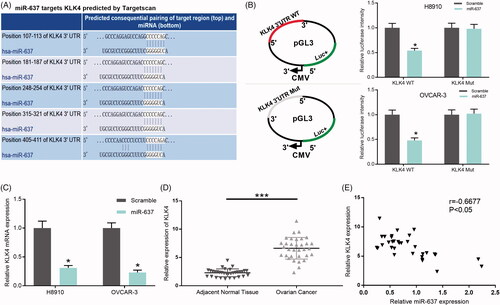
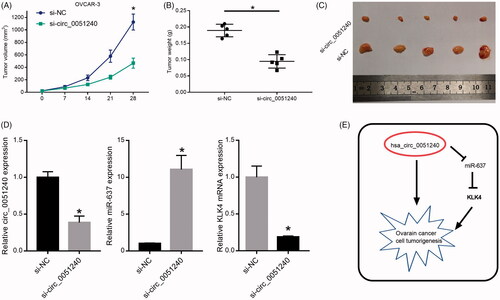
Figure 8. Hsa_circ_0051240 knock-down inhibits OC tumour formation in vivo. OVCAR-3 cells were transfected with si-NC and si-circ_0051240, respectively. The nude mice were injected with the transfected cells (2 × 10⁶ cells) for 7, 14, 21 and 28 days, respectively. (A) The parameters of tumour growth were measured, and the tumour volumes (mm3) were counted (*p < .05). (B) The tumour weights (g) were measured (*p < .05). (C) The dissected tumours were photographed, respectively. (D) Total RNA was extracted from the dissected tumours, and circ_0051240, miR-637 and KLK4 expressions were detected by qRT-PCR assay (*p < .05). (E) The diagrammatic sketch of the circ_0051240/miR-637/KLK4 axis in OC is shown.