Figures & data
Table 1. Sequences of primers for quantitative reverse transcription-polymerase chain reaction (qRT-PCR).
Figure 1. SEM microimages of gelatin microspheres (A, B) and BMP-2-loaded gelatin microspheres (C, D).
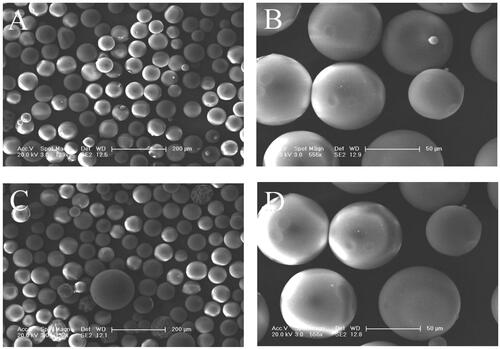
Figure 2. SEM microimages of internal structures for PLGA scaffold (A, B and C) and PLGA/GMs scaffold (D, E and F). The arrows indicate pores after removing sodium chloride particulates, pores by phase inversion and gelatin microspheres.
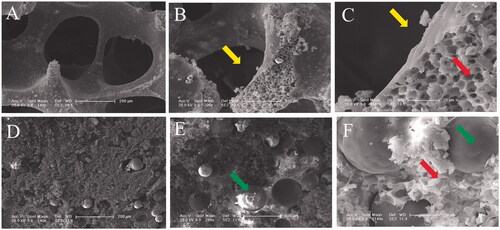
Figure 3. Compressive strength of PLGA and PLGA/GMs scaffolds. The data were represented as mean ± standard deviation (SD; n = 3; *p < .05).
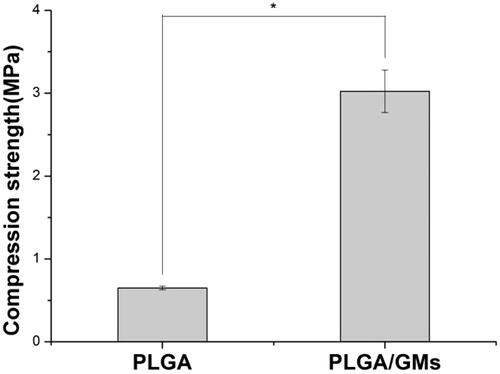
Figure 4. Release kinetics of BMP-2 from PLGA and PLGA/GMs scaffolds.
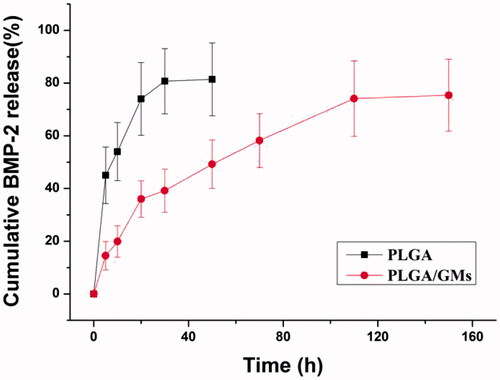
Figure 5. Cell proliferation on PLGA, PLGA/GMs and PLGA/GMs/BMP-2 scaffolds on days 1, 3 and 7. The data were represented as mean ± standard deviation (SD; n = 3; *p < .05).
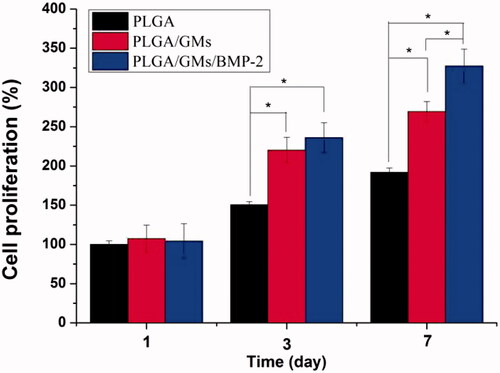
Figure 6. ALP activities of BMSCs in PLGA, PLGA/GMs and PLGA/GMs/BMP-2 scaffolds during 14-d in vitro culture. The data were represented as mean ± standard deviation (SD; n = 3; *p < .05).
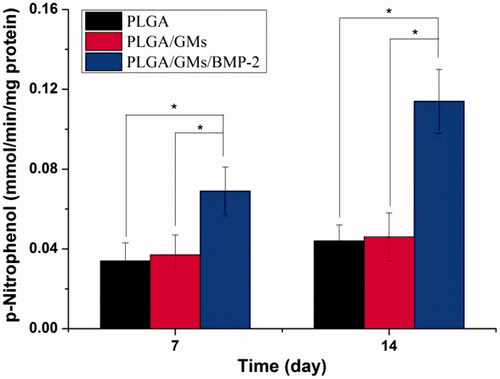
Figure 7. Calcium deposition after culturing in PLGA, PLGA/GMs and PLGA/GMs/BMP-2 scaffolds for 14 and 21 d. The data were represented as mean ± standard deviation (SD; n = 3; *p < .05).
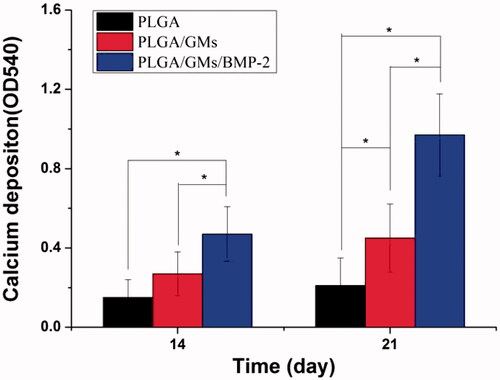
Figure 8. Quantitative analyses of osteogenesis-related gene expressions (i.e. Col-I (a) and OPN (b)). The data were represented as mean ± standard deviation (SD; n = 3; *p < .05).
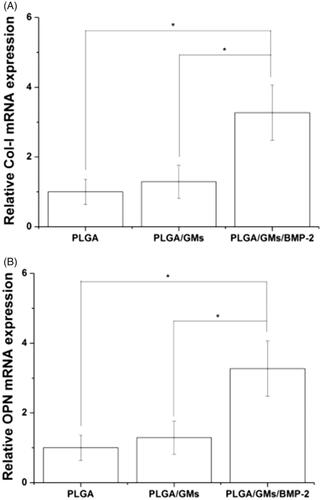
Figure 9. DR images of longitudinal sections of rabbit radius defects with (A–D) and without (E–H) X-ray irradiation 12 weeks after the application of empty PLGA/GMs scaffolds (control) (A and E), PLGA/GMs scaffolds containing bone marrow (BM) (B and F), BMP-2-releasing PLGA/GMs scaffolds (BMP) (C and G), and BMP-2-releasing PLGA/GMs scaffolds with bone marrow (BM/BMP) (D and H). Scale bars correspond to the length of 20 mm.
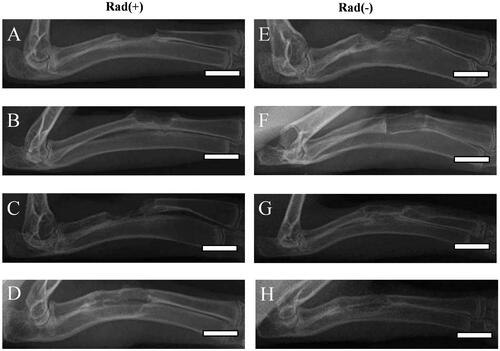
Figure 10. Lane–Sandhu X-ray scores at 12 weeks post-surgery. The data were represented as mean ± standard deviation (SD; n = 6; *p < .05).
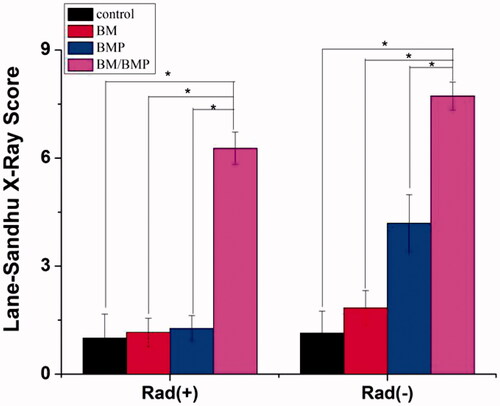
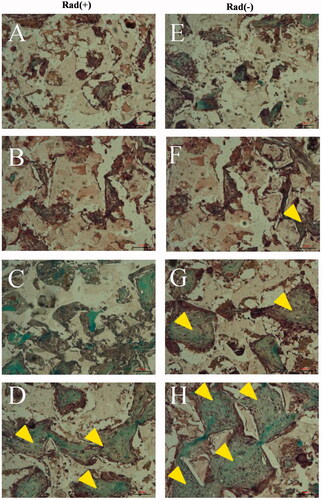
Figure 11. Histological evaluation with haematoxylin and eosin staining. Histological sections of rabbit radius defects with (A–D) and without (E–H) X-ray irradiation 12 weeks after the application of control (A and E), BM (B and F), BMP (C and G) and BM/BMP (D and H). The yellow triangle indicates the new bone formation. Scale bars are 100 μm.
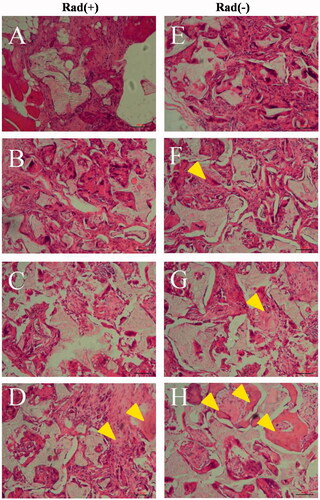
Figure 12. Histological evaluation with Masson Trichrome staining. Histological sections of rabbit radius defects with (A–D) and without (E–H) X-ray irradiation 12 weeks after the application of control (A and E), BM (B and F), BMP (C and G) and BM/BMP (D and H). The yellow triangle indicates the new bone formation. Scale bars are 100 μm.