Figures & data
Figure 1. Mouse iPSCs colonies. Morphology of mouse iPSCs colonies after 2 days of culture on a layer of inactivated MEFs.
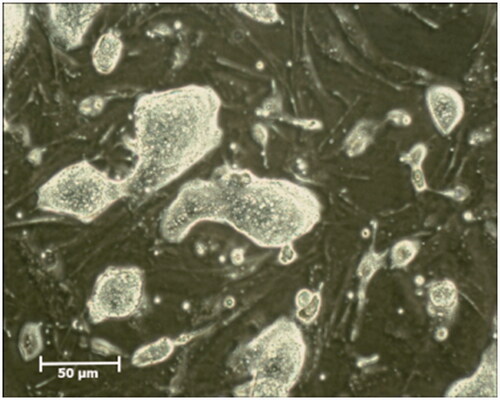
Figure 2. DiI labelled iPSCs colony Fluorescence image of iPSCs colony that labelled by DiI (A) Phase-contrast microscopy of iPSCs colony morphology. (B) Merged image of iPSCs and DiI labelled colony (C).
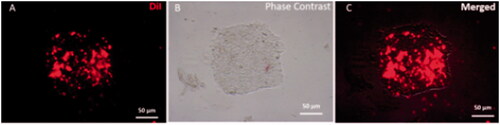
Figure 3. Preparation of agarose gel stand and 3D organ culture. The prepared gel agarose was cut into pieces of 10 mm × 10 mm × 5 mm in size. Three or four pieces of agarose gel were placed in each well of 6 wells plate and were soaked with the medium. The testis was fragmented into ∼1 cm × 1 cm × 1 cm pieces to be appropriate for organ culture. Testes fragments were put on the agarose gel in the three-dimensional organ culture method. Agarose gel is shown by the white arrow, and fragmented testis is pointed by the black arrow.
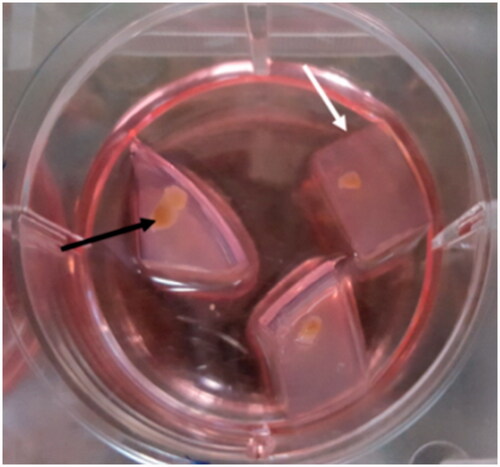
Figure 4. Cells transplantation into seminiferous tubules. The cell suspension was injected into seminiferous tubules through the efferent duct using a fine microinjection needle (A). ∼70–90% of seminiferous tubules were filled in each recipient testis. (B) Seminiferous tubules are shown by the white arrow, and the efferent duct is indicated by black arrow.
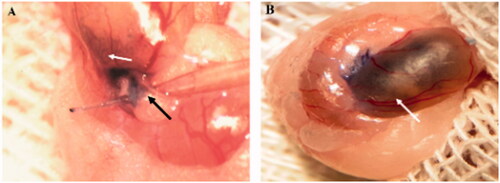
Table 1. Primers used for qRT PCR analysis of spermatogonial stem cells gene markers.
Figure 5. Mouse iPSCs Characterization. Mouse iPSCs were characterized by immunofluorescence staining and specific pluripotent antibodies including Oct4, Sox2 and Klf4. iPSCs were strongly positive for pluripotent stem cell markers Oct-4, Sox2 and Klf4 (green) (A, D, G). Nuclei were stained blue with DAPI. (B, E, H). The merged picture of iPSCs colony with positive pluripotent stem cell markers and DAPI staining (C, F, I).
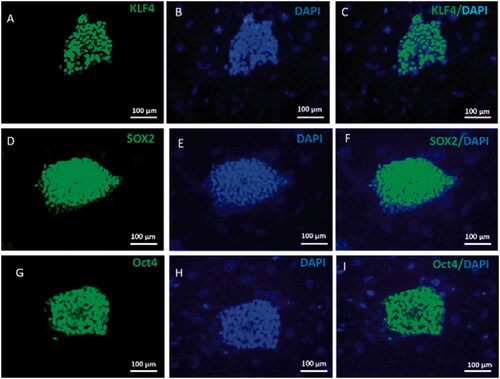
Figure 6. Photomicrograph of tissue sections following 2-weeks culture. In Photomicrograph of tissue sections following 2-weeks culture; the clearness in the center of the tissue section represents the tubules access to nutrition.
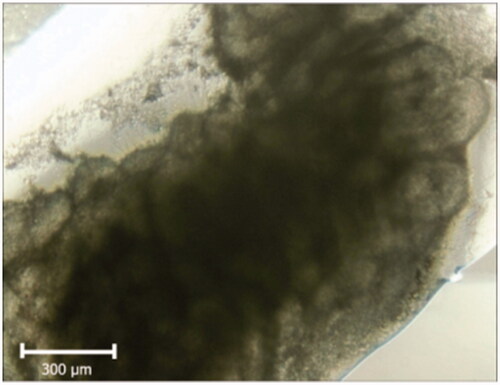
Figure 7. Assessment of morphological changes. H&E staining showing the morphology of mouse testes after 4 weeks of 40 mg/kg busulfan treatment most seminiferous tubules are depleted and no spermatogenetic activity. (A) Wild type mouse testis without busulfan treatment, seminiferous tubules contain spermatogonia, spermatid and spermatozoa. (B) Host testis 2 weeks after iPSCs transplantation and morphological changes from in vivo studies. Restoration of spermatogenesis in seminiferous tubule following iPSCs transplantation is illustrated (C) compared to the control group (D). Histological section of testis fragment cultured for 2 weeks following iPSCs transplantation and 3D organ culture. Due to the cutting of seminiferous tubules, they are not seen regularly in the tissue section. The initiation of spermatogenesis process is visible in the seminiferous tubule of host testis fragments (E) in comparison to control testis (F).
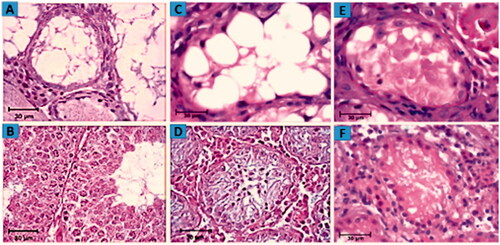
Figure 8. Relative gene expression profile of pre-meiotic Plzf, Vasa, Thy1 and Gfra1 by qRT-PCR. Gene expression of target genes in iPSCs before and 2 weeks after cells transplantation in experimental groups were evaluated by Real Time PCR (qPCR). Data were normalized againt β-actin and represented by mean ± SE after three times repeats. Target gene expressions in experimental groups were investigated in relation to genes expression in iPSCs before transplantation. There are Different letters indicating statistically significant differences between groups (p < .05).
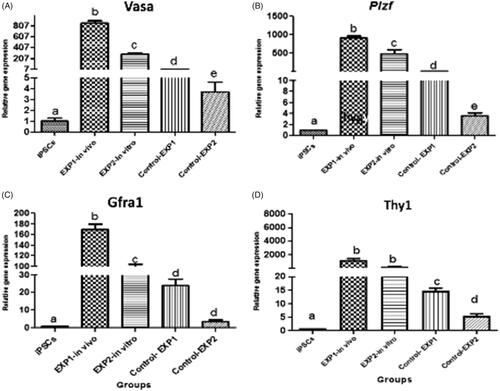
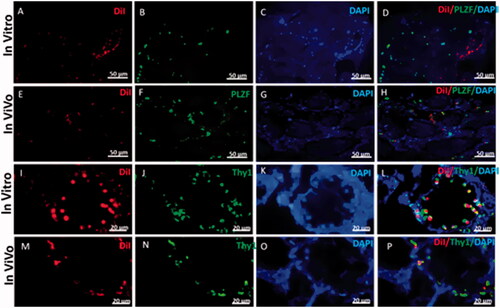
Figure 9. Representative immunohistostaining of SSCs markers in testis section 2 weeks after in vivo cells transplantation and 3D organ culture DiI fluorescent-labelled cells were traced in the recipient testes by fluorescent red light. Images (A, E, I and M) show that the DiI positive cells are localized at the base of seminiferous tubules and have gained homing. The host testis sections were immunostained by the antibodies for Plzf and Thy1 (green) (B, F, J and N). DAPI was used for nuclei staining. (C, G, K and O). The co-localization Plzf and Thy1with DiI labelled iPSCs (D, H, L and P) around seminiferous tubules in recipient testes transplanted is shown by fluorescent microscope.