Figures & data
Table 1. The primer sequences used in the present study.
Figure 1. SEM micrographs showing the morphology of the PCL-PEG nanofibres: (A) free PCL-PEG; (B) Chrysin 5% loaded PCL-PEG nanofibre; (C) Chrysin 10% loaded PCL-PEG nanofibre; (D) Chrysin 15% loaded PCL-PEG nanofibre; (E) Curcumin 5% loaded PCL-PEG nanofibre; (F) Curcumin 10% loaded PCL-PEG nanofibre; (G) Curcumin 15% loaded PCL-PEG nanofibre; (H) Chrysin 5%-Curcumin 10% loaded PCL-PEG; (I) Chrysin 7.5%-Curcumin 7.5% loaded PCL-PEG and (J) Chrysin 10%-Curcumin 5% loaded PCL-PEG.
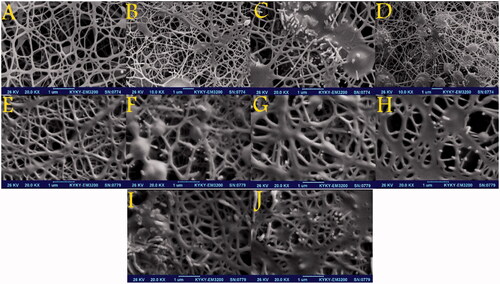
Figure 2. FTIR spectrum of: (a) PCL-PEG-PCL triblock copolymers, (b) Curcumin PCL-PEG nanofiber, (c) Chrysin PCL-PEG nanofiber, and (d) Chrysin–Curcumin PCL-PEG nanofiber.
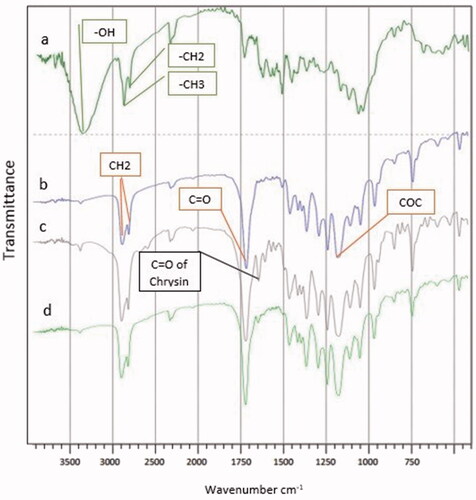
Figure 3. Release behaviour of chrysin and curcumin loaded nanofibres in PBS: (A) Chrysin loaded PCL-PEG nanofibre and (B) Curcumin loaded PCL-PEG nanofibre. (a) Chrysin 5%, (b) Chrysin 10%, (c) Chrysin 15%, (d) Curcumin 5%, (e) Curcumin 10%, and (f) Curcumin 15%.
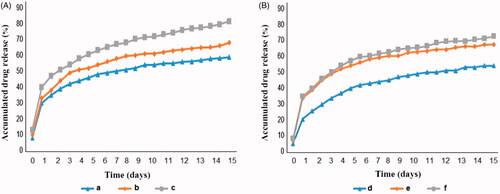
Figure 4. Manipulation of Chrysin 7.5%-Curcumin 7.5% loaded nanofibre on the wound.
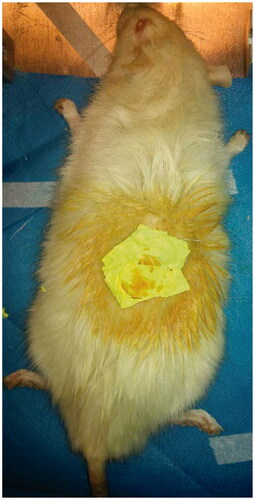
Figure 5. Wound closure percentage: (A) Chrysin, (B) Curcumin and (C) Chrysin–Curcumin-loaded nanofibres. The X-axis represents the elapsed day and the Y-axis shows the wound closure percentage.
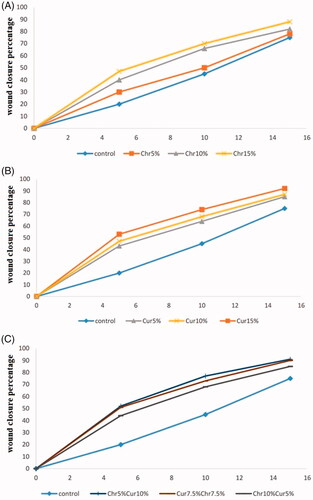
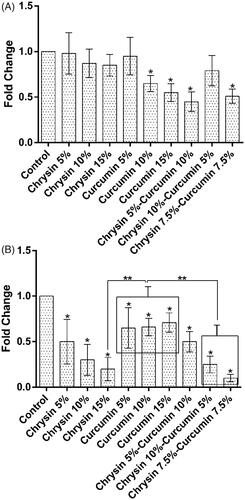
Figure 6. The expression of IL-6 after (A) 5 days treatment (B) 10 days treatment. X-axis represents the study groups and Y-axis shows fold change of the genes. Statistical analysis was performed by ANOVA. Each point represents the mean ± SEM. *p values <.05 vs. control. **p < .05.
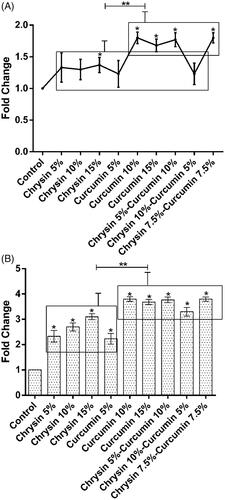
Figure 7. The expression of MMP-2 after (A) 5 days of treatment and (B) 10 days of treatment. The X-axis represents the study groups and the Y-axis shows the fold change of the genes. Statistical analysis was done by ANOVA. Each point represents the mean ± SEM. *p values < .05 vs. control. **p < .05.
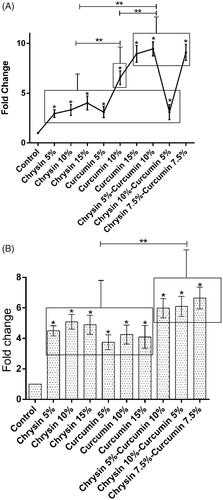
Figure 8. The expression of TIMP-1 after (A) 5 days of treatment and (B) 10 days of treatment. X-axis represents the study groups and Y-axis shows the fold change of the genes. Statistical analysis was done by ANOVA. Each point represents the mean ± SEM. *p values < .05 vs. control. **p < .05.
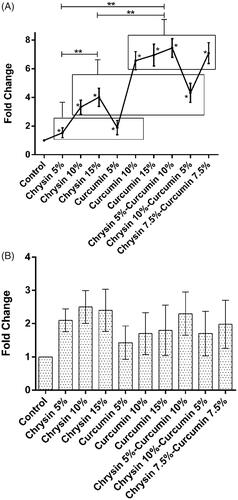
Figure 9. The expression of TIMP-2 after (A) 5 days of treatment and (B) 10 days of treatment. The X-axis represents the study groups and the Y-axis shows the fold change of the genes. Statistical analysis was done by ANOVA. Each point represents the mean ± SEM. *p values < .05 vs. control. **p < .05.
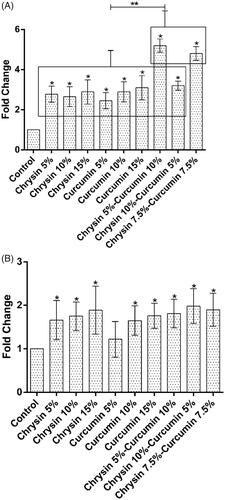
Figure 10. The expression of iNOS after (A) 5 days of treatment and (B) 10 days of treatment. The X-axis represents the study groups and Y-axis shows the fold change of the genes. Statistical analysis was done by ANOVA. Each point represents the mean ± SEM. *p values <.05 vs. control. **p < .05.