Figures & data
Figure 1. Ropivacaine induces fission-like changes in mitochondrial morphology. Human SH-SY5Y neuronal cells were treated with 0.5% and 1% ropivacaine for 72 h. Mitochondrial morphology was measured by MitoTracker red staining; nuclei were stained with DAPI. The overlay pictures were shown to overall mitochondrial morphology. The insets were amplified mitochondrial structure.
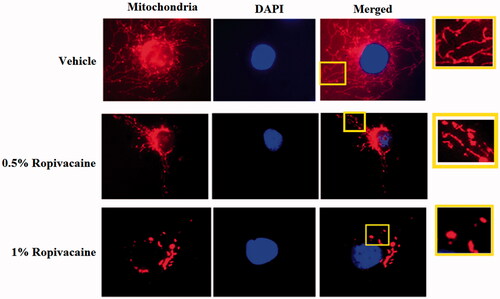
Figure 2. Ropivacaine treatment increases the expression of mitochondrial fission protein DRP1. Human SH-SY5Y neuronal cells were treated with 0.5% and 1% ropivacaine for 72 h. (A) Ropivacaine increases the expression of DRP1, but not Mfn 1 and Mfn2 at the mRNA level; (B) Ropivacaine increases the expression of DRP1, but not Mfn 1 and Mfn 2 at the protein level (*, #, P < .01 vs. previous column group).
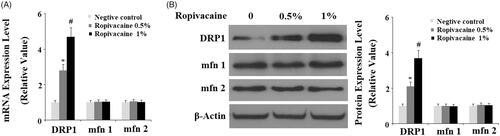
Figure 3. Ropivacaine induced mitochondrial dysfunction in human SH-SY5Y neuronal cells. Human SH-SY5Y neuronal cells were treated with 0.5% and 1% ropivacaine for 72 h. (A) Mitochondrial membrane potential measured by TMRM; (B) Cytochrome c oxidase activity; (C) Intracellular ATP levels (*, #, P < .01 vs. previous column group).
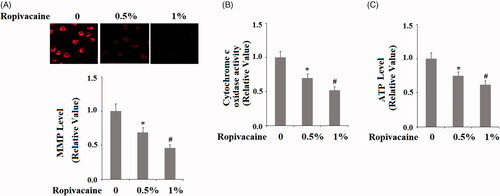
Figure 4. Ropivacaine-induced generation of intracellular ROS. Human SH-SY5Y neuronal cells were treated with 0.5% and 1% ropivacaine for 72 h. Intracellular ROS was determined by DCFH-DA assay (*, #, P < .01 vs. previous column group).
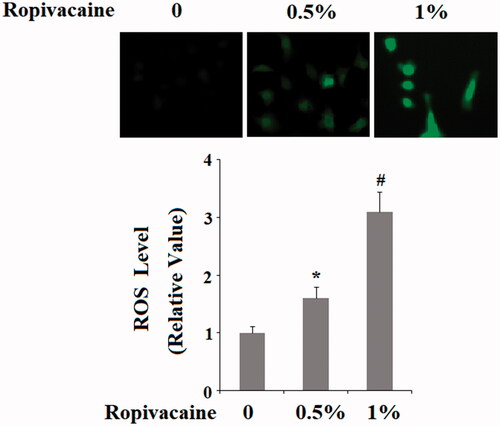
Figure 5. Silencing of DRP1 ameliorated ropivacaine-induced mitochondrial fission. Human SH-SY5Y neuronal cells were infected with DRP1 siRNA Ad-virus for 12 h, followed by treatment with 0.5% and 1% ropivacaine for 72 h. Mitochondrial morphology was measured by MitoTracker red staining.
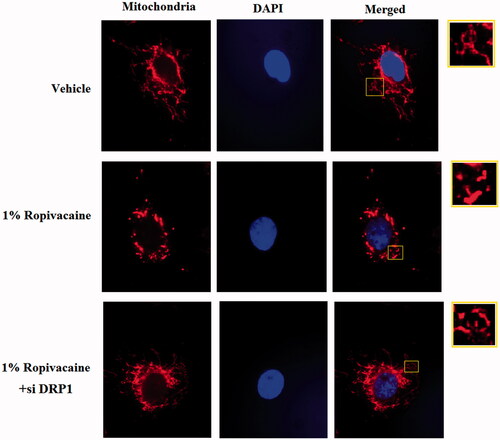
Figure 6. Silencing of DRP1 ameliorated ropivacaine-induced mitochondrial dysfunction. Human SH-SY5Y neuronal cells were infected with DRP1 siRNA Ad-virus for 12 h, followed by treatment with 0.5% and 1% ropivacaine for 72 h. (A) Cytochrome C oxidase activity; (B) Intracellular ATP levels (*, #, P < .01 vs. previous column group).
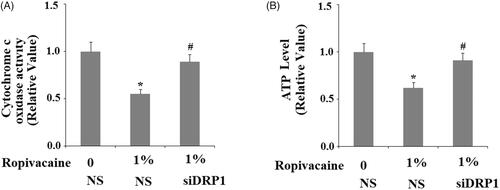
Figure 7. Silencing of DRP1 ameliorated ropivacaine-induced release of LDH and reduction of cell viability. Human SH-SY5Y neuronal cells were infected with DRP1 siRNA Ad-virus for 12 h, followed by treatment with 0.5% and 1% ropivacaine for 72 h. (A) LDH release; (B) Cell viability was determined by MTT assay (*, #, P < .01 vs. previous column group).
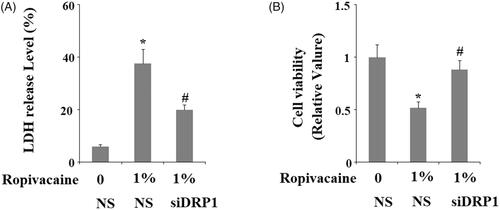
Figure 8. Silencing of DRP1 ameliorated ropivacaine-induced apoptosis. Human SH-SY5Y neuronal cells were infected with DRP1 siRNA Ad-virus for 12 h, followed by treatment with 1% ropivacaine for 72 h. Apoptosis was determined by flow cytometry (*, #, P < .01 vs. previous column group).
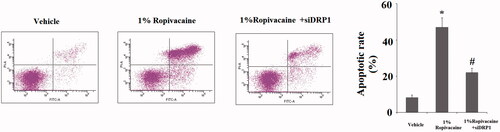
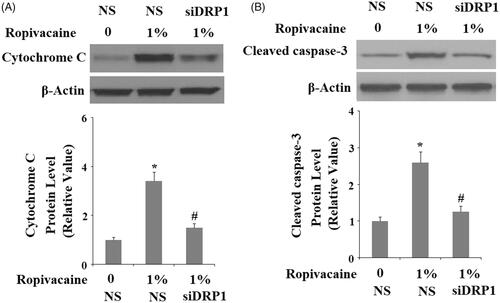
Figure 9. Silencing of DRP1 ameliorated ropivacaine-induced cytochrome C release from mitochondria to cytosol and activation of caspase-3. Human SH-SY5Y neuronal cells were infected with DRP1 siRNA Ad-virus for 12 h, followed by treatment with 1% ropivacaine for 72 h. (A) Cytochrome C in cytosol; (B) Cleaved caspase-3 (*, #, P < .01 vs. previous column group).