Figures & data
Figure 1. Comparison of cell characteristics of dental pulp stem cells (DPSCs) and adipose-derived stem cells (ADSCs). (A) Cell morphology of DPSCs and ADSCs. (B) The results of flow cytometric analysis of DPSCs and ADSCs. (C) Crystal violet staining revealed the colony forming unit of DPSCs and ADSCs. (D) Quantitative analysis of colony-forming units in each group. (E) Proliferation curves of DPSCs and ADSCs. (F) Crystal violet staining revealed the migratory cells in cultures of DPSCs and ADSCs, and (G) Quantitative analysis of migratory cells in each group. Data are presented as the mean ± standard deviation of the mean (n = 3), **P < .01. Scale bar: 100 µm.
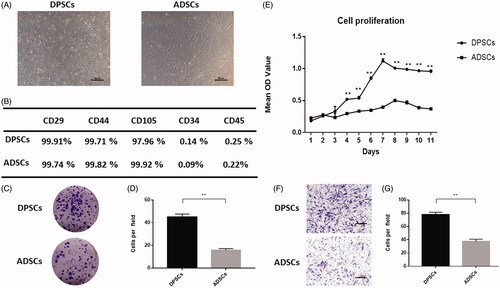
Figure 2. Cell multi-differentiation potential. (A) Alkaline phosphate (ALP) staining at 3, 5, and 7 days after osteogenic induction. (B) ALP activity in the two groups at each time-point determined by ALP semi-quantitatively. (C) Cultures of DPSCs and ADSCs stained with ARS after 7, 14, and 21 days of osteogenic induction. (D) Cultures of DPSCs and ADSCs stained with Oil Red O after 7, 14, and 21 days of adipogenic induction Data are presented as the mean ± standard deviation of the mean (n = 3), **P < .01. Scale bar: 100 µm.
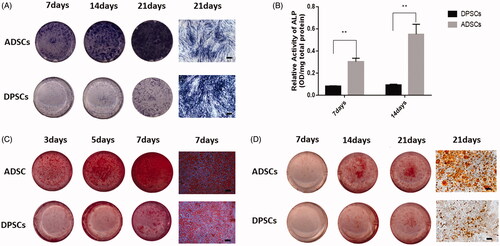
Figure 3. Expression of osteogenic and angiogenic markers in DPSCs and ADSCs. The mRNA levels of (A) BMP2, (B) RUNX2, and (C) ALP (osteogenesis-related genes) (D) VEGF, and (E) PECAM1 (angiogenesis-related gene) are shown. (F) VEGF secreted from DPSCs and ADSCs, detected by ELISA. Data are presented as the mean ± standard deviation of the mean (n = 3), *P < .05, **P < .01.
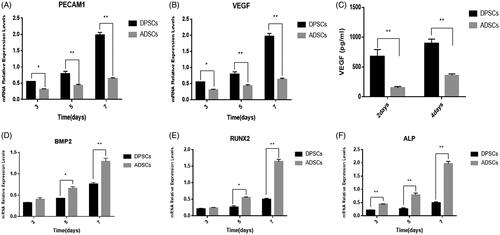
Figure 4. The analysis of DPSC and ADSC promotion of bone regeneration by micro-CT. (A) Micro-CT images taken at 6 weeks after implantation of 0.2% Puramatrix™ alone, 0.2% Puramatrix™/DPSC complex, or 0.2% Puramatrix™/ADSC complex, respectively. (B) Bone volume/total volume (BV/TV), (C) trabecular number (Tb.N), (D) trabecular thickness (Tb.Th), and (E) trabecular separation (Tb.Sp) by micro-CT for each group at 6 weeks post operation. Data are presented as the mean ± standard deviation of the mean (n = 3), *P < .05, **P < .01. Scale bar: 200 µm.
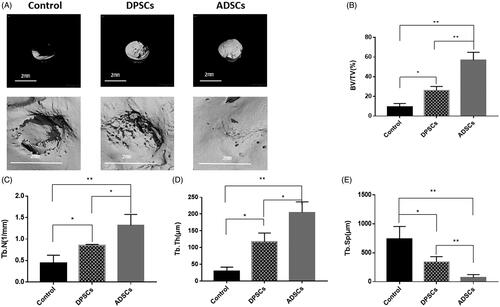
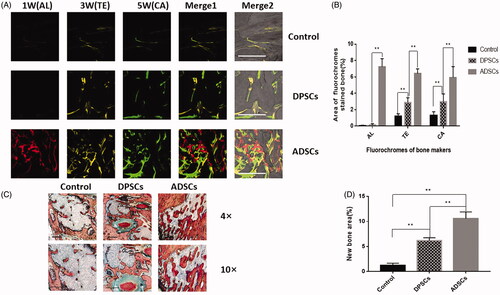
Figure 5. Analysis of DPSCs and ADSCs promotion of bone regeneration. (A) Sequential fluorescent labelling of AL, TE, and CA was administrated at 1, 3, 5 weeks post-operation. Images of column “Merge 1” represent the merged three fluorochromes. “Merge 2” represents merged images of the three fluorochromes together with the plain confocal laser microscope image. (B) The percentage of TE, AL, and CA staining for each group assessed at week 6 after implantation. (C) Histological analysis revealed that both DPSCs and ADSCs promoted bone regeneration, shown by van Gieson’s staining. The new bone area is shown in red. (D) The percentage of new bone area was assessed at 6 weeks after implantation by histomorphometric analysis. Data are presented as the mean ± standard deviation of the mean (n = 3), *P < .05, **P < .01. Scale bar: 500 µm.