Figures & data
Figure 1. UV–visible spectrum absorption pattern and dynamic light scattering of gold nanoparticles synthesised from Scutellaria barbata. (A). UV-visible absorption spectrum of synthesized AuNPs. (B). Dynamic light scattering (DLS) images of AuNPs
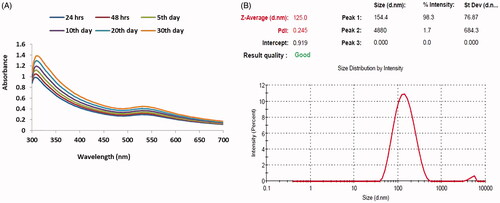
Figure 2. HR-transmission electron microscopy (HR-TEM) and energy dispersive X-ray analysis (EDX) of gold nanoparticles synthesised from Scutellaria barbata. (A) Transmission electron microscopy (HR-TEM) and (B) energy dispersive X-ray (EDX) and analysis AuNPs synthesised from Scutellaria barbata.
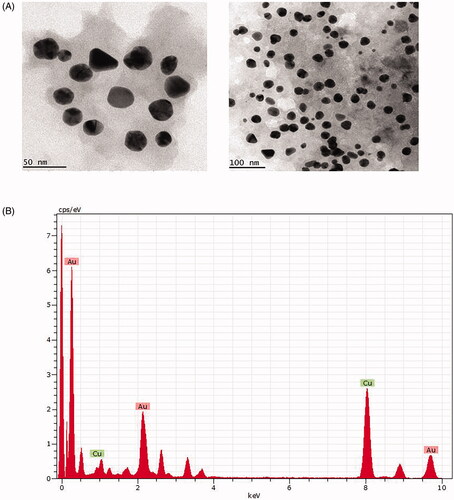
Figure 3. Fourier transform infrared (FTIR) spectroscopy analysis and SAED pattern of AuNPs synthesized from Scutellaria barbata.
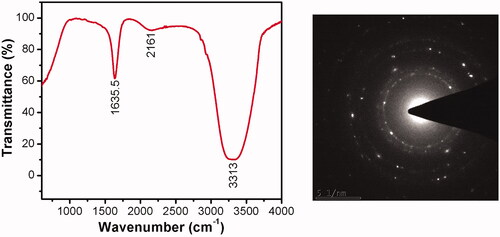
Figure 4. Atomic force microscopy analysis of gold nanoparticles synthesised from Scutellaria barbata.
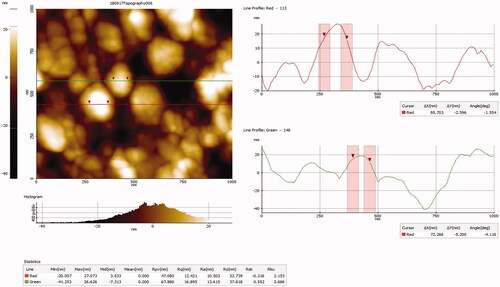
Figure 5. Effect of synthesized gold nanoparticles on intracellular ROS generation. This experiment was repeated thrice and the bars in the graph represent S.E. (**p < .05, ***p < .01).
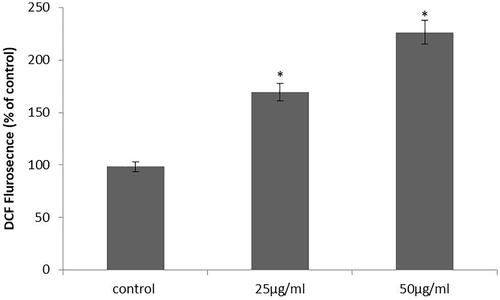
Figure 6. Cytotoxic activity of the synthesized gold nanoparticles and Scutellaria barbata extract in 24, 48 and 72 h. (A) MTT assay of gold nanoparticles. (B) MTT assay of Scutellaria barbata extract. This experiment was repeated thrice and the bars in the graph represent S.E. (**p < .05, ***p < .01).
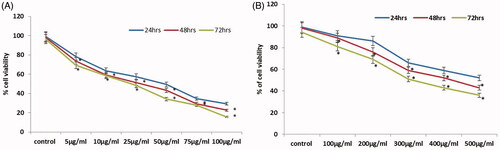
Figure 7. Effect of synthesized gold nanoparticles on morphological assessment of PANC-1 cells stained with acridine orange (green) and propidium iodide (red).
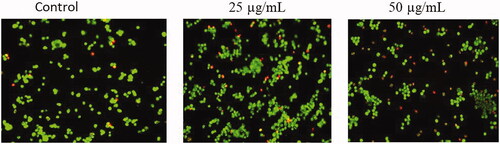
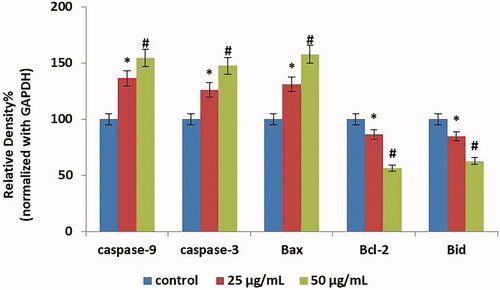
Figure 8. Effect of synthesized gold nanoparticles on apoptosis related protein expressions. PANC-1 cells were treated with gold nanoparticles (25 and 50 µg) for 24 h and dose-dependent changes in the expressions of Bid, Bcl-2, and Bax were monitored by Western blotting. β-actin was used as a loading control.
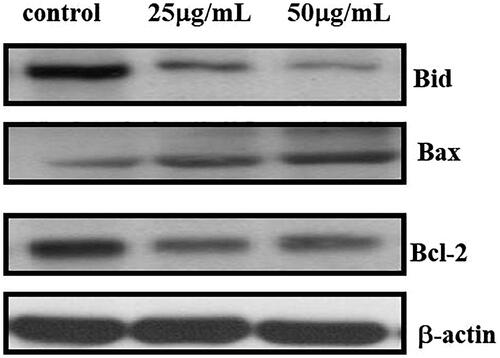
Figure 9. Effect of synthesized gold nanoparticles on apoptotic gene expressions by qRT-PCR. This experiment was repeated thrice and the bars in the graph represent S.E. (**p < .05, ***p < .01).