Figures & data
Figure 1. Pladienolide B significantly inhibited HeLa cell viability and colony formation. (A) Chemical structure of pladienolide B. (B) MTS assay revealed that the viability affected by pladienolide B. (C) Representative images of the colony formation potential of HeLa cells treated with different concentration of pladienolide B. (D) Quantitative representation of the colony counts was shown. It is indicated that pladienolide B decreased cell and colony growth. All experiments were performed in triplicate. The data are expressed as the mean ± SD.***p < .001 (vs. control group).
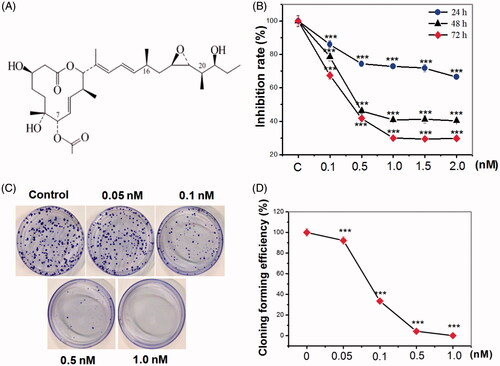
Figure 2. Pladienolide B inhibited SF3b1 expression. (A) The effect of pladienolide B on spacial distribution of SF3b1 protein. (B) Representative western blot images. (C) Quantitative analysis showed the effect of 0.1 nM, 0.5 nM, and 2 nM pladienolide B on SF3b1 expression in HeLa cells. All experiments were performed in triplicate. The data are expressed as the mean ± SD. ***p < .001 (vs. control group). *p < .05 (vs. control group).
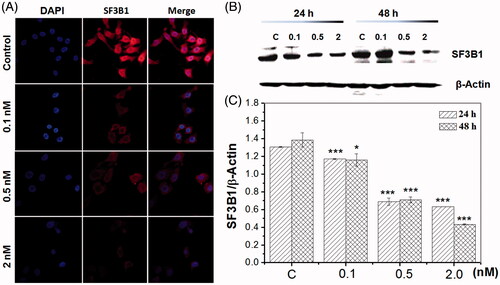
Figure 3. Inhibition of SF3b1 by pladienolide B inhibited cell cycle arrest, but induced apoptosis in human cervical carcinoma HeLa cells. (A) Cell cycle arrest observation was investigated with flow cytometry. (B) Apoptotic effect of pladienolide B on human cervical carcinoma HeLa cells. (C) Percentages of G2/M phase of cell population was calculated. (D) Percentages of apoptotic and dead rate and of cell population was calculated. All experiments were performed in triplicate. The data are expressed as the mean ± SD. ***p < .001 (vs. control group). **p < .01 (vs. control group).
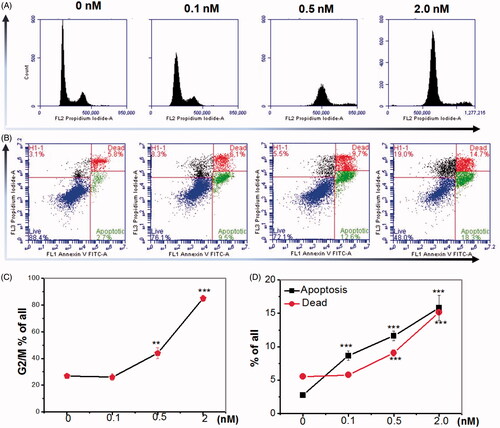
Figure 4. Inhibition of SF3b1 by pladienolide B increased the protein ratio of Tap73//Np73 in human cervical carcinoma HeLa cells, indicating activation of apoptosis in p53-independent manner. (A) Gene structure and alternative transcripts of human TP73. (B) Representative western blot images. (C) Quantitative analysis of Tap73 and ΔNp73 proteins in HeLa cells by western blot analysis. (D) The localization of Tap73 and ΔNp73 protein in HeLa cells supplemented with Pladienolide B were determined by fluorescent microscopy. All experiments were performed in triplicate. The data are expressed as the mean ± SD. ***p < .001 (vs. control group).
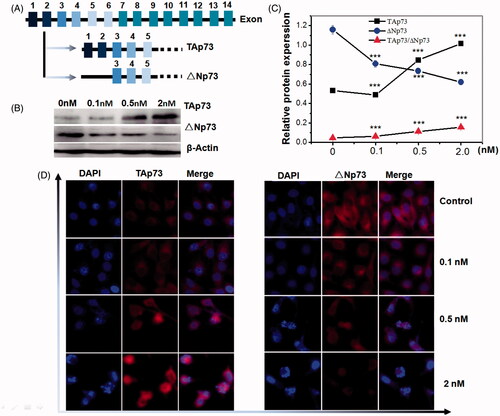
Figure 5. Inhibition of SF3b1 by pladienolide B up-regulates Bax/Bcl-2 ratio, and induces caspase activation in human cervical carcinoma HeLa cells. (A) Representative western blot images. (B, C) Quantitative analysis of the ratio of Bax/Bcl-2, pro-caspase 3 were represented by column graphs. β-Actin was used as a loading control. All experiments were performed in triplicate. The data are expressed as the mean ± SD. ***p < .001(vs. control group). **p < .01(vs. control group).
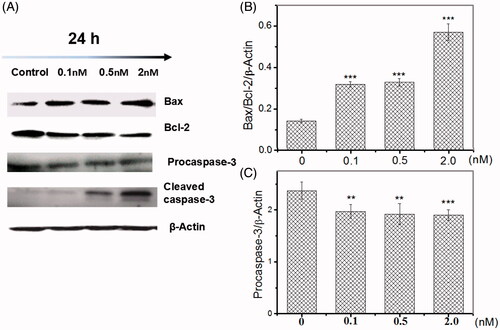
Figure 6. Inhibition of SF3b1 by pladienolide B promotes cytochrome c release in human cervical carcinoma HeLa cells. (A) The localization of cytochrome c protein in HeLa cells was determined by fluorescent microscopy. (B) Representative western blot images. (C) Quantitative analysis of cytochrome c was represented by column graphs. β-Actin was used as a loading control. All experiments were performed in triplicate. The data are expressed as the mean ± SD. ***p < .001 (vs. control group).
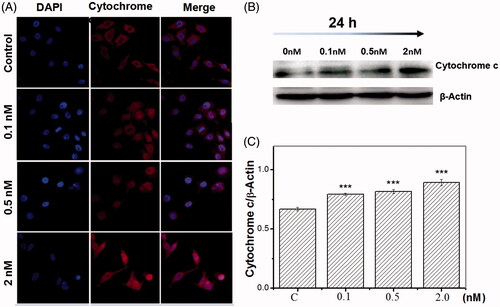
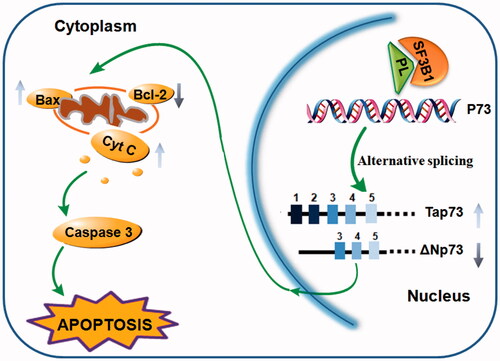
Figure 7. Model of potential targets of SF3b1 in cancer. Pladienolide B increased the racial of Tap73/ΔNp73 expression which regulated apoptosis, and consequently down-regulated Bax/Bcl-2 ratio, cytochrome c release and caspase-3 expression in human cervical cancer cells.