Figures & data
Figure 1. Pentamidine structure (Source [Citation11]).
![Figure 1. Pentamidine structure (Source [Citation11]).](/cms/asset/c8f967cf-7c62-4e7c-b5e6-089cf9fe380f/ianb_a_1596923_f0001_b.jpg)
Figure 2. Particle physicochemical properties of unloaded, pentamidine-loaded and freeze dried pentamidine-loaded PCL nanoparticles. (A) Sizes, (B) PDIs, (C) Zeta potentials. Data is presented as mean ± SE. Sample size (n = 6). No statistical differences were found at p < .05.
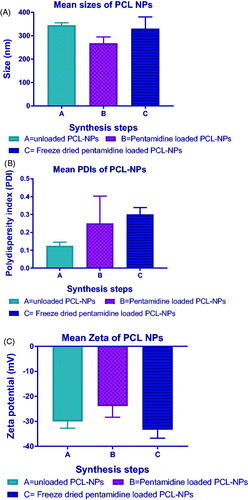
Figure 3. Liposomal particle physicochemical properties of unloaded, pentamidine-loaded and freeze dried pentamidine-loaded liposomes. (A) Sizes, (B) PDI, (C) Zeta potential. Data is presented as mean ± SE. Sample size (unloaded and loaded liposomes n = 3 and freeze-dried n = 1(pooled sample)). No statistical differences were found at p < .05.
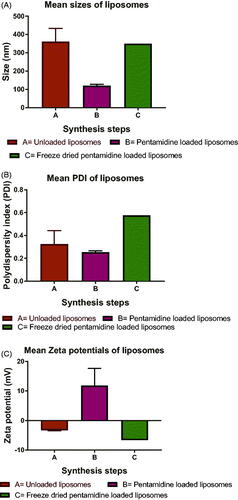
Figure 4. These are electron micrographs of freeze dried PCL nanoparticles (A) and freeze dried liposomes (B) generated by SEM. The legends were generated by SEM and all bars calibrated at 1 µm.
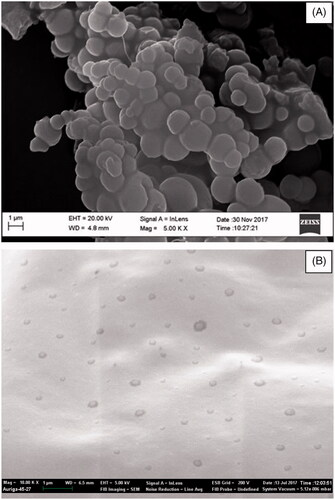
Figure 5. Shows the toxic effect of 5 mg/ml concentration of unloaded PCL NPs on the growth of b.End5 cells. Data is presented as mean ± SE, n = 3. No statistical differences were found at p < .05.
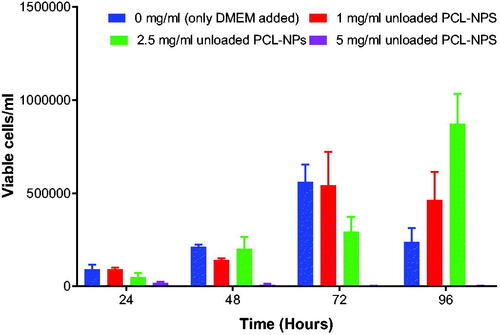
Figure 6. Shows the effect of different concentrations of pentamidine-loaded NPs on the growth b.End5 cells. Data is presented as mean ± SE, n = 3. No statistical differences were found at p < .05.
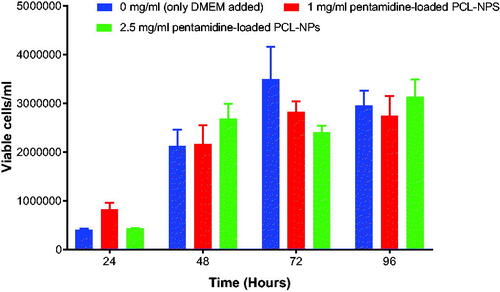
Figure 7. Shows toxic effect of 2.5 mg/ml and 5 mg/ml concentrations of pentamidine-loaded liposomes on the growth of b.End5 cells. Data is presented as mean ± SE, n = 3. Statistical significant difference was found with 2.5 mg/ml concentration at p < .05.
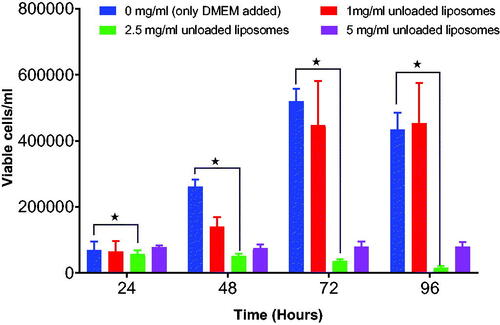
Figure 8. Shows the effect of different concentrations of pentamidine- loaded liposomes on growth of b.End5 cells. Data is presented as mean ± SE, n = 3. No statistical difference was found at p < .05.
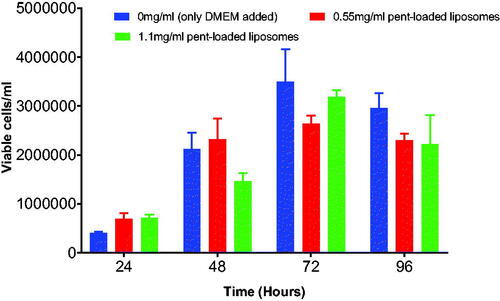
Figure 9. Shows the effect of different concentrations of free pentamidine on the growth of b.End5 cells. 200 µg/ml and 400 µg/ml were severely toxic to cells that no cells could grow. Both concentrations had statistical significant difference at p < .05. Data is presented as mean ± SE of mean, n = 3.
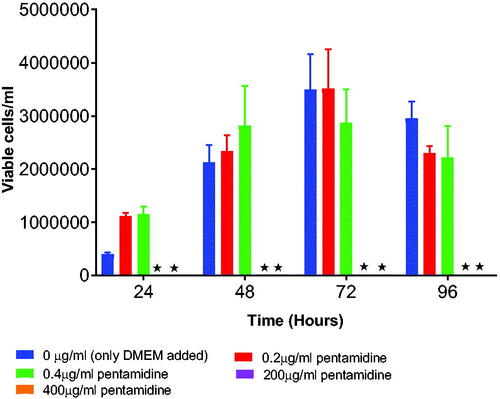
Figure 10. The effects of pentamidine-loaded PCL nanoparticles, pentamidine loaded liposomes and free pentamidine on the TEER of b.End5 cell monolayers. Data is presented as mean ± SE, n = 3. No statistical difference was found at p < .05.
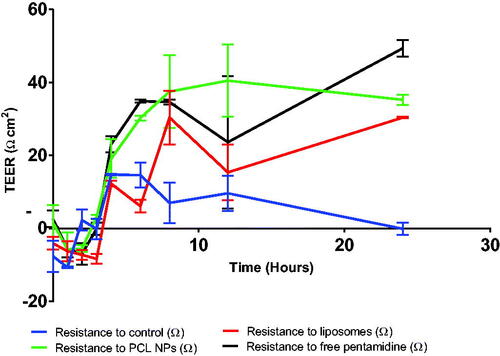
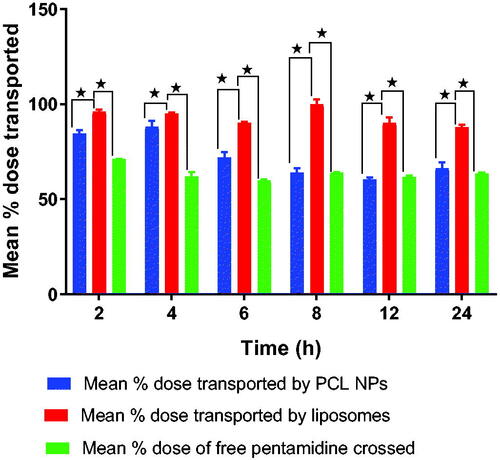
Figure 11. Shows the percentage dose of free pentamidine, pentamidine-loaded PCL NPS and pentamidine-loaded liposomes transported across the cells monolayer. Here, we were testing the transportation ability of liposomes and PCL NPs nanocarriers to ferry pentamidine across the BBB as compared to free movement of pentamidine. Data is presented as mean ± SE, n = 3. Transport means differences between liposome and PCL NPs, and liposome and free drug were found statistically significant at p < .05.