Figures & data
Figure 1. The expression levels of miR‑342 expression in AML. (A) The expression levels of miR‑342 expression in bone marrow AML patients and control groups. (B) The expression levels of miR-342 in patients’ sera and healthy controls. p-values were calculated using ANOVA. *p < .01 compared with the normal control group.
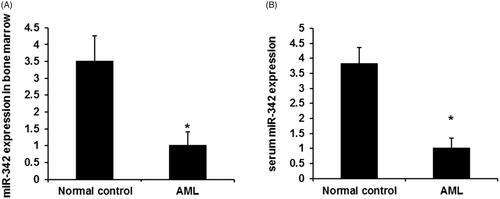
Figure 2. MiR-342 upregulation repress cell proliferation and G1/S transition of human leukemia cells. (A) MiR-342 mimics induced miR-342 expression in Kg1a and HL60 cells. (B) MTT assay revealed the effects of miR-342 on cell proliferation in Kg1a and HL60 cells. (C) The effects of MiR-342 on G1/S transition in Kg1a and HL60 cells. p < .01 vs. normal controls.

Figure 3. MiR-342 directly target 3′-UTR of Naa10p mRNA. (A) The putative miR-342-binding sequence in the 3′-UTR of Naa10. (B) Luciferase report assay was used to reveal the target role of miR-342 on Naa10p. p < .01 vs. control groups.
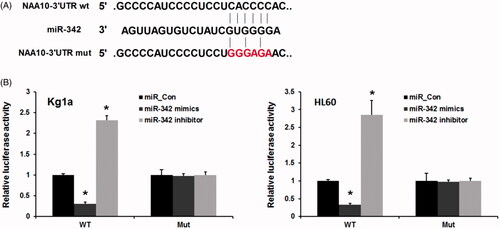
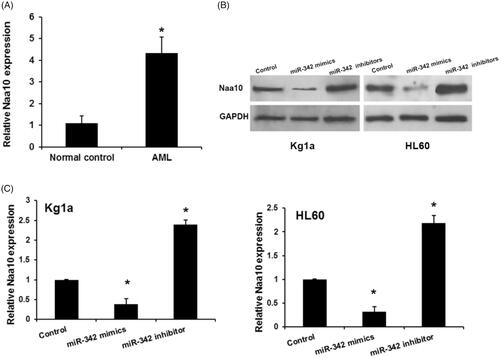
Figure 4. Naa10 is upregulatd in AML and regulated by miR-342. (A) Expression levels of Naa10 in ALM. *p < .05, comparison with normal control groups B and C, miR-342 remarkably regulated Naa10 protein and mRNA expression in Kg1a and HL60 cells, respectively. Each sample was examined in triplicate. *p < .05, comparison with control groups.