Figures & data
Table 1. Density and porosity in membranes.
Figure 1. FTIR spectra for H. perforatum oil and membranes (electro-spun PEG membrane, electro-spun PCL membrane, co-electrospun PEG-PCL membrane 0 & 1).
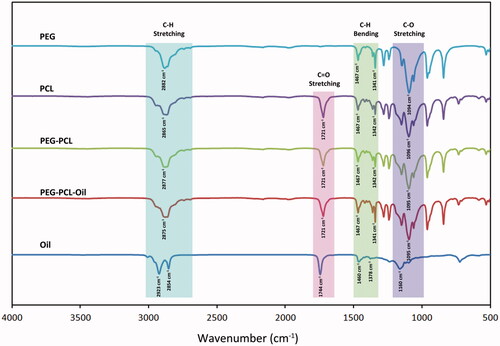
Figure 2. SEM images of top and bottom layers of 7% (v/v) H. perforatum oil containing PEG-PCL membrane: top layer of the membrane made of PCL fibres, (A) x200 magnification, (B) x400 magnification; bottom layer of the membranes in contact with the wound (PCL fibres and thin PEG fibres carrying the PEG capsules with H. perforatum oil), (C) x400 magnification, (D) x1000 magnification.
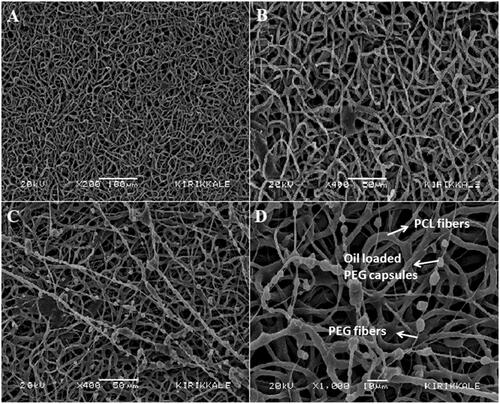
Table 2. Tensile test results for the membranes.
Table 3. Contact angle values of the membrane layers with/without oil.
Figure 3. Degree of swelling ratios (%) of the membranes (membrane 0 & 1) related by time.
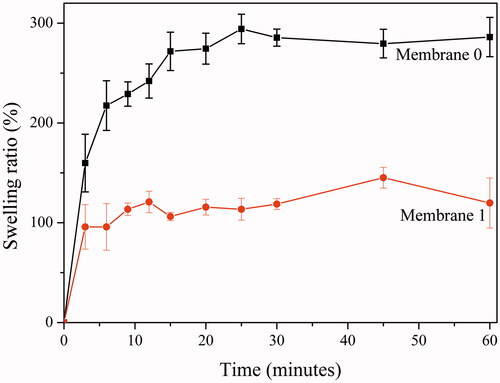
Figure 4. Weight remaining (%) of membrane 0 and membrane 1 in time.
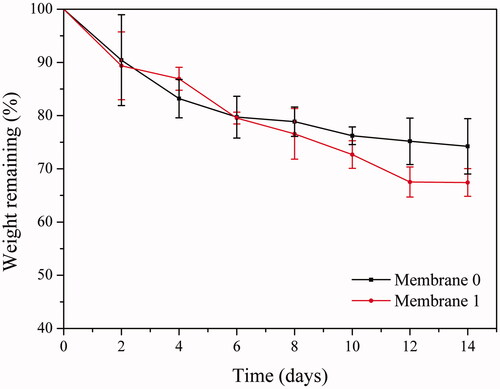
Figure 5. Controlled release of H. perforatum oil from membrane 1 (14 & 2 days).
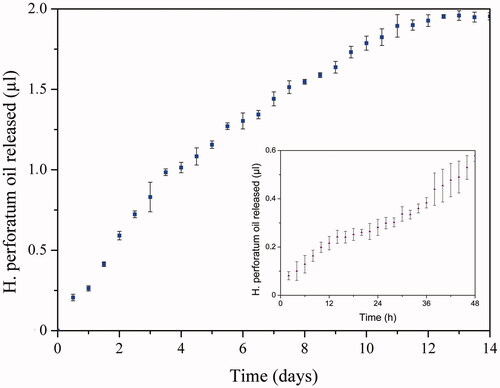
Figure 6. Antibacterial effects of membranes (membrane 0, 1, 2, 3) on E. coli (A) & S. aureus (B).
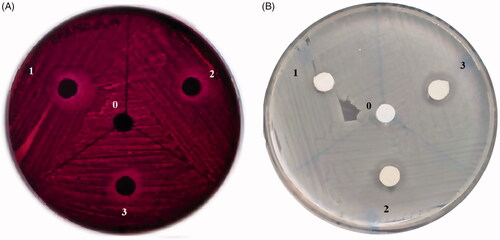
Table 4. Inhibition zone diameters of membranes (membrane 0, 1, 2, 3) on E. coli and S. aureus.
Figure 7. SEM images of oil loaded membranes (1, 2 and 3) incubated with L929 mouse fibroblast cells after two days with different magnifications; 200X (A1-B1-C1); 400X (A2-B2-C2) and 800X (A3-B3-C3).
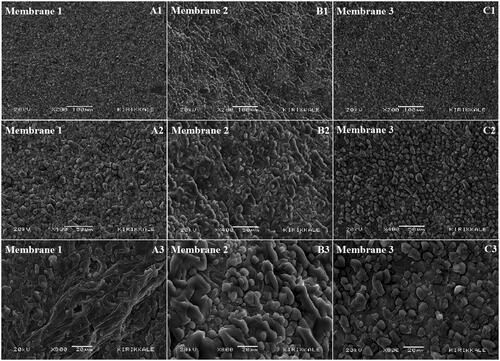
Figure 8. Apoptosis/necrosis (%) and cell viability (%) of control groups (positive/negative) and membrabes (0, 1, 2, 3).
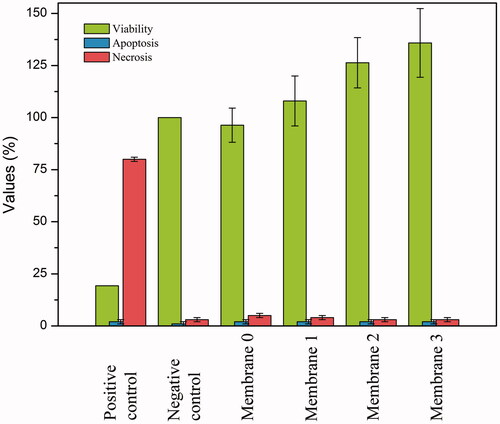
Table 5. Cytotoxicity/WST-1 test results and apoptosis/necrosis (%) values.
Figure 9. Fluorescence microscopy images of apoptotic/necrotic cells of membranes (0, 1, 2, 3).
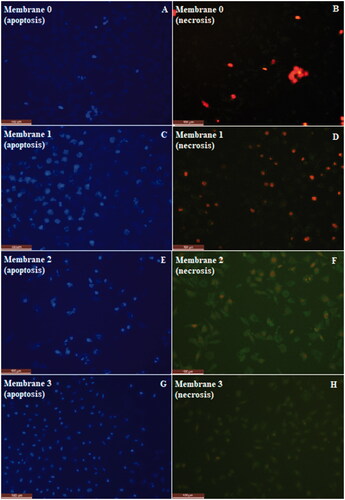
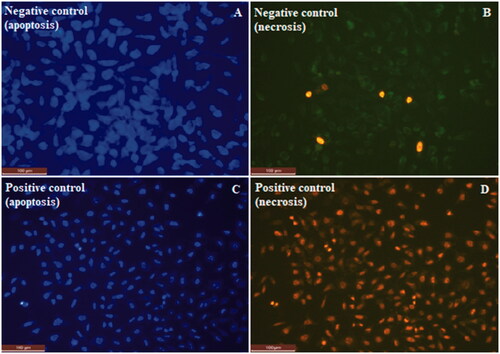
Figure 10. Fluorescence microscopy images of apoptotic/necrotic cells of negative and positive control groups.