
Figures & data
Table 1. The primers of RT-PCR.
Figure 1. The mRNA levels of IL-4, IL-10, TNF-α, and IFN-γ in the colon tissues of various groups which were evaluated by RT-PCR. Control: the control group; Model: the model group; Ad5: the Ad5 group (adenovirus empty vector); Ad5-CDC42: the Ad5-CDC42 group (CDC42 adenovirus expression vector). *p < .05 vs. control. #p < .05 vs. model. §p < .05 vs. Ad5.
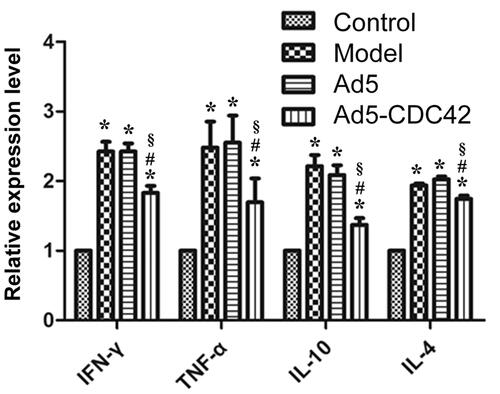
Figure 2. The protein levels of IL-4, IL-10, TNF-α, and IFN-γ in the colon tissues of various groups which were assessed by western blot. Control: the control group; Model: the model group; Ad5: the Ad5 group (adenovirus empty vector); Ad5-CDC42: the Ad5-CDC42 group (CDC42 adenovirus expression vector). *p < .05 vs. control. #p < .05 vs. model. §p < .05 vs. Ad5.
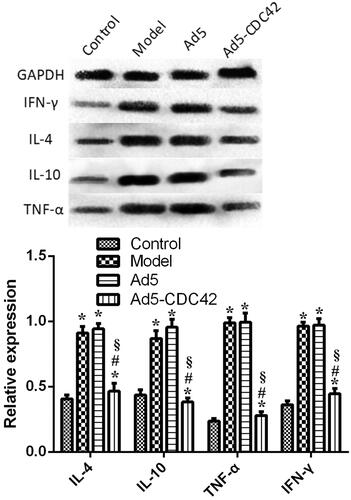
Figure 3. The contents of IL-4, IL-10, TNF-α, and IFN-γ in the serum of various groups which were determined by ELISA assay. Control: the control group; Model: the model group; Ad5: the Ad5 group (adenovirus empty vector); Ad5-CDC42: the Ad5-CDC42 group (CDC42 adenovirus expression vector). *p < .05 vs. control. #p < .05 vs. Model. §p < .05 vs. Ad5.
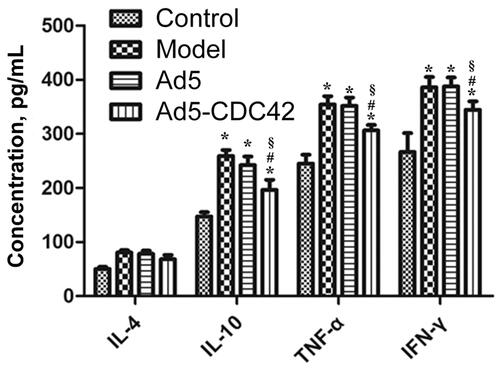
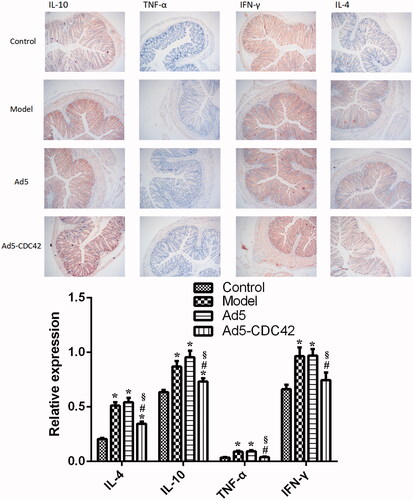
Figure 4. The immunohistochemical results of IL-4, IL-10, TNF-α, and IFN-γ in the colon tissues of various groups. Target proteins were displayed in brown. Magnification × 100. Control: the control group; Model: the model group; Ad5: the Ad5 group (adenovirus empty vector); Ad5-CDC42: the Ad5-CDC42 group (CDC42 adenovirus expression vector). *p < .05 vs. control. #p < .05 vs. Model. §p < .05 vs. Ad5.
Data availability
The analyzed data sets generated during the study are available from the corresponding author on reasonable request.