Figures & data
Figure 1. Schematic view of the whole synthesis, drug loading and release behaviour of the hybrid magnetic CNT in the tumour microenvironment.
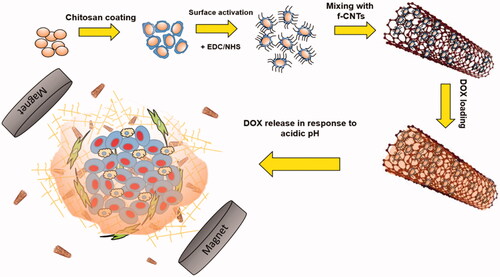
Figure 2. SEM images of the (A) f-CNT and (B) hybrid Chi-MnFe2O4/CNT, Scale bare is 100 nm. C) XRD analysis of the hybrid Chi-MnFe2O4/CNT sample.
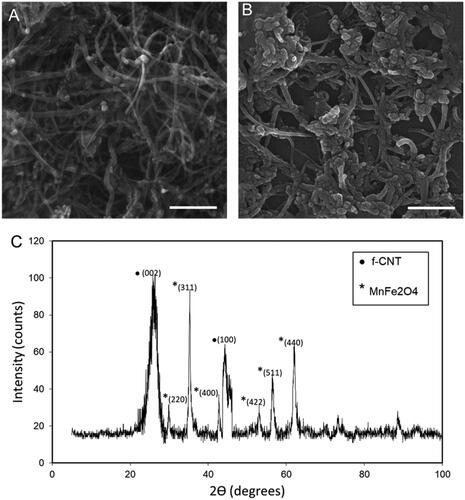
Figure 3. (A) FTIR spectra of the (I) f-CNT and (II) Chi- MnFe2O4/CNT samples. (B) VSM plot of the MnFe2O4, Chitosan coated MnFe2O4 and the hybrid Chi- MnFe2O4/CNT samples.
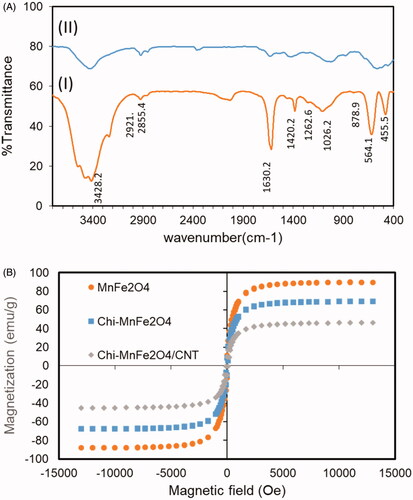
Figure 4. (A) Zeta potential analysis of the samples (B) before magnetic decoration, f-CNT and (C) after magnetic decoration, Chi-MnFe2O4/CNT. (E) Effect of magnetic decoration on the hydrodynamic diameter of the f-CNT.
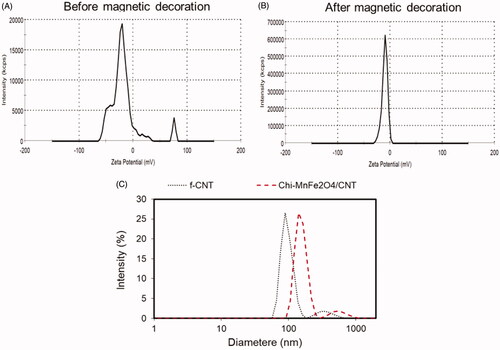
Figure 5. Cumulative release profile of the (A) Chi- MnFe2O4/CNT and (B) f-CNT samples in two experimental pH of 5.3 and 7.
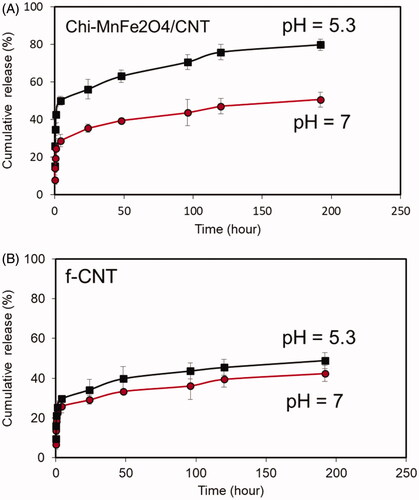
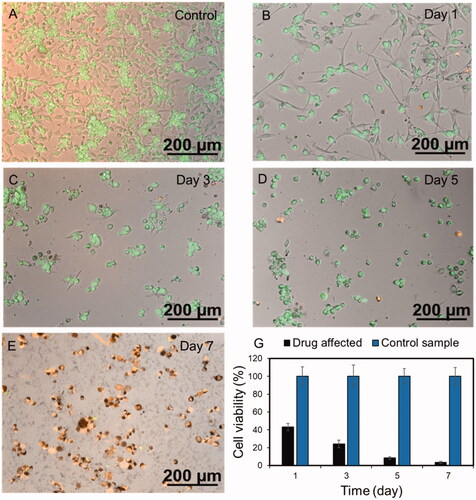
Figure 6. Live-Dead fluorescent imaging of the U-87 gliobalastoma cell line (A) without drug and (B–E) after drug applying. (G) MTT profile of the drug affected U-87 gliobalastoma cells at each time intervals.