Figures & data
Figure 1. FOXD2-AS1 expression was upregulated in OA patients. (A, B) FOXD2-AS1 expression was significantly upregulated and positively associated with the severity of OA patients. (C, D) IL-1β or TNF-α treatment induced FOXD2-AS1 expression in C28/I2 cells. *p < .05.
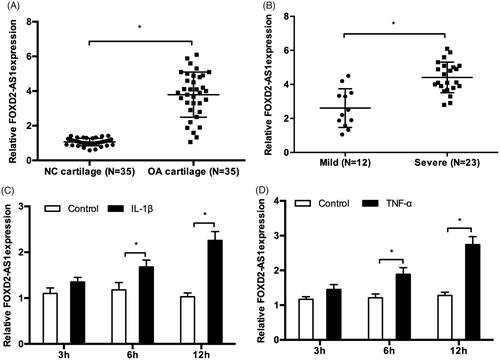
Figure 2. FOXD2-AS1 promoted cell proliferation, inflammation and ECM degradation in chondrocytes. (A) FOXD2-AS1 expression in C28/I2 cells transfected with FOXD2-AS1 overexpression plasmids. (B) FOXD2-AS1 overexpression promoted C28/I2 cells viability in vitro. (C, D) FOXD2-AS1 overexpression induced inflammatory factors expression (IL-6, IL-8) in C28/I2 cells. (E, F) FOXD2-AS1 upregulation reduced the expression of collage II, and aggrecan, while increased the expression of MMP13 in C28/I2 cells both in mRNA and protein levels. *p < .05.
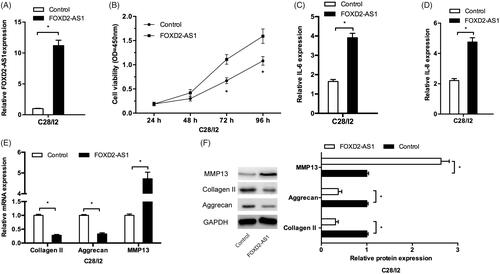
Figure 3. MiR-27a-3p served as a target of FOXD2-AS1. (A) The binding site between FOXD2-AS1 and miR-27a-3p. (B, C) MiR-27a-3p expression was decreased and negatively associated with the severity of OA patients. (D) MiR-27a-3p expression was negatively correlated with FOXD2-AS1 expression in OA tissues. (E) FOXD2-AS1 overexpression reduced miR-27a-3p expression in C28/I2 cells. (F) Luciferase reporter assay showed that miR-27a-3p mimics reduced the luciferase activity of FOXD2-AS1-Wt group. (G) RIP assay showed that FOXD2-AS 1 and miR-27a-3p expression was enriched in Ago2 pellet. *p < .05.
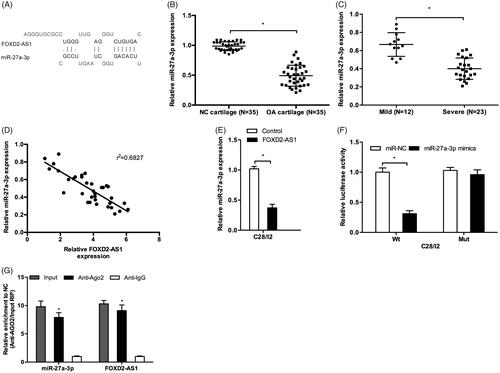
Figure 4. FOXD2-AS1 promoted OA progression via regulating miR-27a-3p. (A) FOXD2-AS1 upregulation promoted C28/I2 cells proliferation, while miR-27a-3p mimics abolished the effects. (B, C) miR-27a-3p mimics reduced inflammatory factors (IL-1β, IL-6) levels in C28/I2 cells transfected with FOXD2-AS1. (D, E) miR-27a-3p mimics promoted collagen II, aggrecan expression and reduced MMP13 expression in C28/I2 cells transfected with FOXD2-AS1 both in mRNA (D) and protein (E) levels. *p < .05.
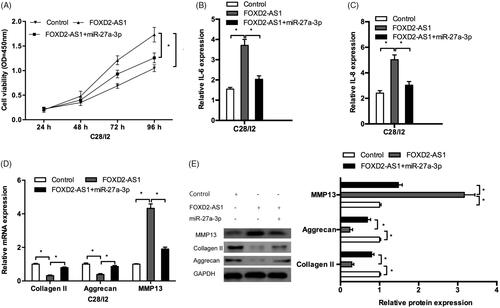
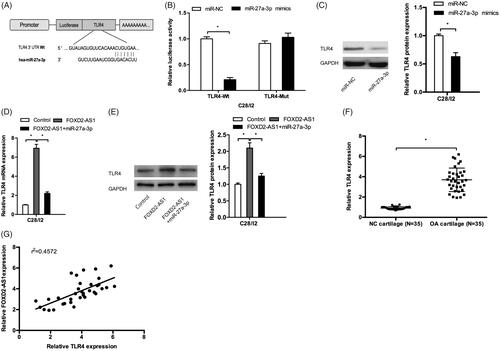
Figure 5. FOXD2-AS1/miR-27a-3p/TLR4 axis mediated the OA progression. (A) The binding site between the miR-27a-3p and TLR4. (B) Luciferase reporter assay showed that miR-27a-3p mimics reduced the luciferase activity of TLR4-Wt group. (C) MiR-27a-3p mimics decreased TLR4 protein levels in C28/I2 cells. (D, E) FOXD2-AS1 overexpression increased TLR4 expression both in mRNA and protein levels in C28/I2 cells, which could be abolished by miR-27a-3p mimics. (F) TLR4 mRNA expression was significantly increased in OA patients. (G) TLR4 mRNA expression was positively correlated with FOXD2-AS1 expression in OA tissues. *p < .05.