Figures & data
Figure 1. Oxygen and glucose deprivation (OGD) decreased cell viability and increased cell apoptosis, and altered ANRIL expression. The effects of OGD on PC-12 cell function and ANRIL expression over time were investigated. (A) Cell Counting Kit-8 (CCK-8) assay of cell viability. (B) Flow cytometric analysis of apoptosis by annexin V-fluorescein isothiocynate (FITC)/propidium iodide (PI) staining. (C-D) Western blot analysis of apoptosis-related protein expression; GAPDH served as the loading control. (E) Quantitative real time polymerase chain reaction (qRT-PCR) analysis of ANRIL expression in PC-12 cells following exposure to OGD. Data represent the mean ± standard deviation (SD) (n = 3) of three independent experiments. *p < .05.
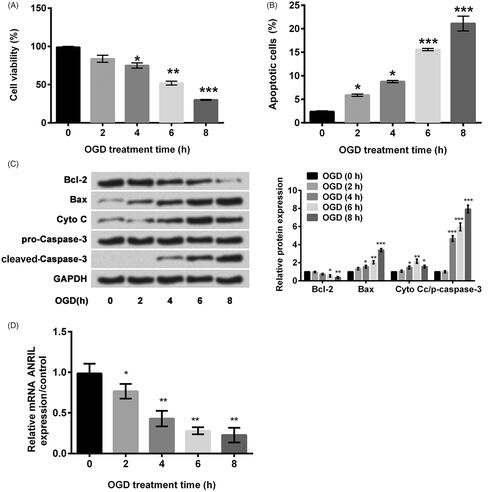
Figure 2. Overexpression of ANRIL reduces oxygen and glucose deprivation (OGD)-induced PC-12 cell injury while silence of ANRIL led to the opposite results. PC-12 cells were transfected with the pc-ANRIL and si-ANRIL and a stably expressing cell line was selected; un-transfected cells and cells transfected with the empty vector (pcDNA3.1) served as negative controls. (A and F) qRT-PCR analysis of ANRIL expression. The effects of ANRIL overexpression on cell injury induced by exposure to OGD (6 h) were then evaluated. (B and G) A Cell Counting Kit-8 (CCK-8) assay of cell viability; (C and H) Flow cytometric analysis of apoptosis by annexin V-fluorescein isothiocynate (FITC)/propidium iodide (PI) staining; (D–E and I–J) Western blot analysis of apoptosis-related protein expression; GAPDH served as the loading control. Data represent the mean ± standard deviation (SD) (n = 3) of three independent experiments. *p < .05.
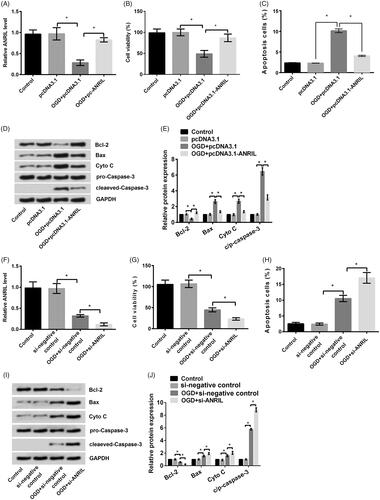
Figure 3. Transfection with miR-127 mimic promoted oxygen and glucose deprivation (OGD)-induced cell injury miR-127 mimic and inhibitor were then used to investigate the role of miR-127 in the mechanism by OGD-induced injury. (A–B) Quantitative real time polymerase chain reaction (qRT-PCR) analysis of miR-127 expression in PC-12 cells was detected by transfected with the miR-127 mimic or inhibitor with or without OGD treatment. Subsequently, PC-12 cells were transfected with the miR-127 mimic or inhibitor prior to exposure to OGD for 6 h. (C) Cell Counting Kit-8 (CCK-8) assay of cell viability; (D) Flow cytometric analysis of apoptosis by annexin V-fluorescein isothiocynate (FITC)/propidium iodide (PI) staining; (E–F) Western blot analysis of apoptosis-related protein expression; GAPDH served as the loading control. Data represent the mean ± standard deviation (SD) (n = 3) of three independent experiments. *p < .05.
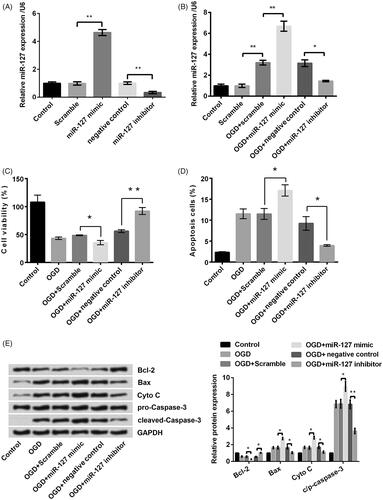
Figure 4. ANRIL protected against oxygen and glucose deprivation (OGD)-induced cell injury through down-regulation of miR-127. (A–B) the expression of miR-127 was detected by qRT-PCR. Then effects of co-transfection with pc-ANRIL and miR-127 mimic was detected by (C) Cell Counting Kit-8 (CCK-8) assay of cell viability; (D) Flow cytometric analysis of apoptosis by annexin V-fluorescein isothiocynate (FITC)/propidium iodide (PI) staining; (E–F) Western blot analysis of apoptosis-related protein expression; GAPDH served as the loading control. Data represent the mean ± standard deviation (SD) (n = 3) of three independent experiments. *p < .05.
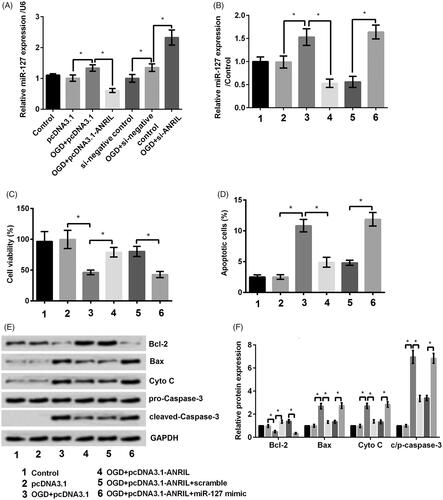
Figure 5. MiR-127 negatively regulated the expression of myeloid cell leukemia 1 (Mcl-1) in PC-12 cells. (A–B) To evaluate the relationship between miR-127 and Mcl-1 expression, PC12 cells were transfected with the miR-127 mimic or inhibitor. Western blot and qRT-PCR analysis were used for determining Mcl-1 protein level and RNA level expression, respectively. (C–D) The expression of Mcl-1 under co-treated with OGD and miR-127 mimic both for protein and mRNA levels by qRT-PCR and western blot. Data represent the mean ± standard deviation (SD) (n = 3) of three independent experiments. *p < .05.

Figure 6. Phosphatidylinositol 3′-kinase (PI3K)/protein kinase B (AKT) Signalling pathways involved in the protective effects of miR-127 suppression in OGD-treated P12 cells. The miR-127 mimic and inhibitor were used to investigate the mechanism by which suppression of miR-127 protects against oxygen and glucose deprivation (OGD)-induced injury in PC-12 cells; (A) Western blot analysis of the components of the PI3K/AKT pathway and Mcl-1 expression under OGD, miR-127 mimic, miR-127 inhibitor and PI3K inhibitor, LY294002. (B) Western blot quantitative analysis. Data represent the mean ± standard deviation (SD) (n = 3) of three independent experiments. *p < .05.
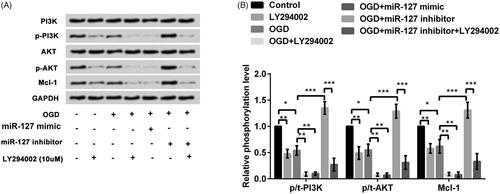
Figure 7. Overexpression of myeloid cell leukaemia 1 (Mcl-1) reduces oxygen and glucose deprivation (OGD)-induced PC-12 cell injury, and suppression of Mcl-1 promoted the cell injury. Cell lines exhibiting Mcl-1 overexpression or suppression by transfection of PC-12 cells with the pEX-Mcl-1 expression vector or sh-Mcl-1, respectively. The empty vector, pEX and sh-negative control were used as controls. (A–B) Western blot andqRT-PCR analysis were used for determining Mcl-1 protein level and RNA level expression, respectively. (C) Cell Counting Kit-8 (CCK-8) assay of cell viability; (D) Flow cytometric analysis of apoptosis by annexin V-fluorescein isothiocynate (FITC)/propidium iodide (PI) staining; (E–F) Western blot analysis of apoptosis-related protein expression; GAPDH served as the loading control. Data represent the mean ± standard deviation (SD) (n = 3) of three independent experiments. *p < .05.
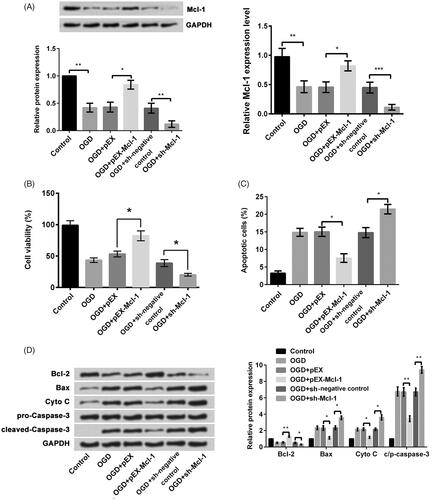
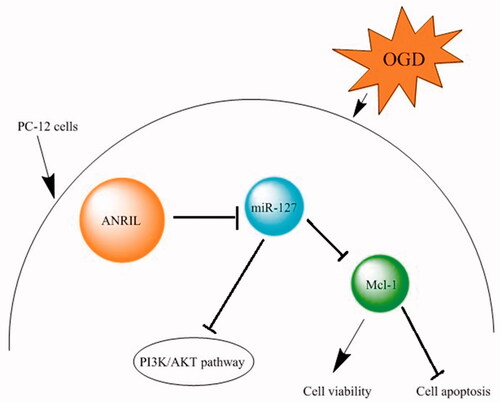
Figure 8. The protective effects of ANRIL in PC-12 cells.