Figures & data
Figure 1. Stem cell secretome collection and cell potential analysis. (A) A schematic diagram of the experimental procedure in vitro. (B) The conditioned medium of hUCMSCs was gathered together and lyophilized. (C) Cell proliferation of stem cells from young and aged rats and effects of different concentrations of secretome on aged BMSCs were analyzed by MTT assay over a period of 5 days. (D) BMSCs were stained for SA-β-gal and the quantitative result was expressed in a bar graph. Scale bar = 100 μm. (E) The level of ROS in BMSCs was judged by fluorescence microscopy analyses after labelling with DCFH-DA. Scale bar = 200 μm. (F) Age-related gene changes in p16, p21 and p53 were detected by qRT-PCR. Representative results of three experiments are shown. *p < .05 vs O-C group.
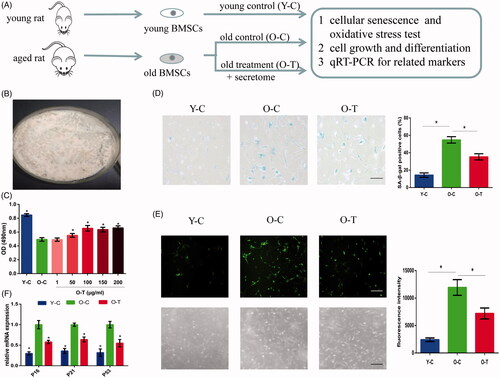
Figure 2. Osteogenic and adipogenic differentiation potential of BMSCs from young and aged rats and the effect of secretome on aged BMSC differentiation were investigated in vitro. (A, C) Osteogenic differentiation of BMSCs was examined using Alizarin Red S Staining and osteogenic specific markers including RUNX2 and OCN. (B) Adipogenic differentiation of BMSCs was investigated in vitro by taking Oil Red O staining. (D) Adipogenic markers including PPAR-γ2 and leptin were also tested. The bar graph represents quantitative data of staining intensities observed. Scale bar = 100 μm. Representative results of three experiments are shown. *p < .05 vs O-C group.
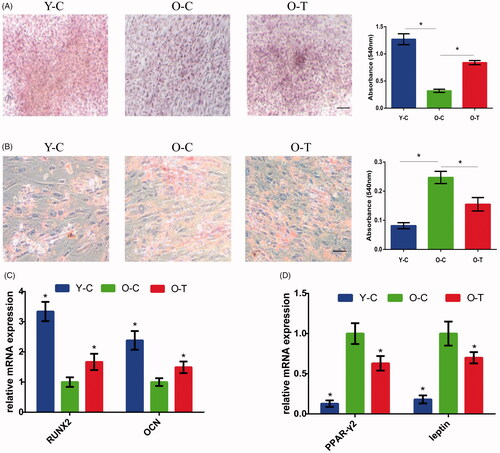
Figure 3. Preparation of secretome-loaded silk fibroin hydrogels and morphology analysis. (A) Schematic illustration of silk sol-gel transition and secretome capsulation. (B) Silk powder was dissolved in deionized water and silk solution was transformed into silk hydrogel by ultrasonication. (C) Silk hydrogel morphology determined by SEM.
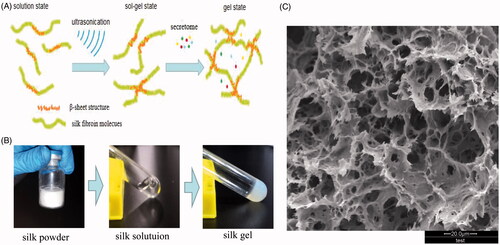
Table 1. Primer sequences for qRT-PCR.
Figure 4. Silk fibroin hydrogels properties analysis and intratibial injection. (A) A schematic diagram of the experimental procedure in vivo. (B) The bioactivity of released secretome was analyzed by MTT assay, representative results of three experiments are shown. *p < .05 vs NCG. (C) Cumulative release rate of TGF-β from silk gels detected by ELISA. (D) Silk hydrogel was injected into the bone marrow cavity of a rat. (E) Histological study of degradation performance of silk gels at weeks 2 and 8. *Represents remaining gels. Scale bar = 100 μm.
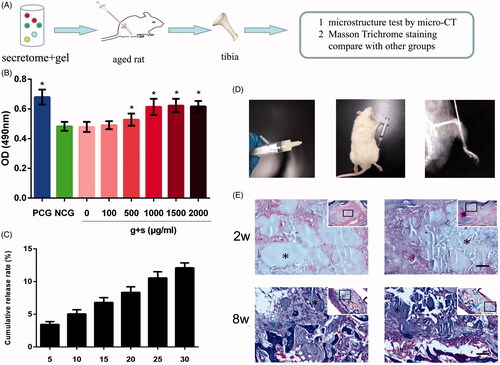
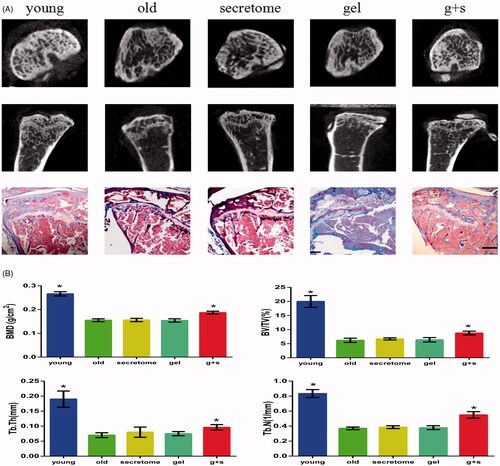
Figure 5. Micro-CT and Masson trichrome staining analysis of tibias from different groups. (A) Representative images from micro-CT and Masson staining of trabecular bone from the tibias. Scale bar =500 μm. (B) Bone characteristics were analyzed through bone mineral density (BMD), trabecular bone volume/total tissue volume (BV/TV), trabecular thickness (Tb.Th), and trabecular number (Tb.N). *p < .05 vs old group.