
Figures & data
Figure 1. X‐ray diffractogram (A) and transmission electron microscopy (TEM) image of copper oxide nanoparticles (B).
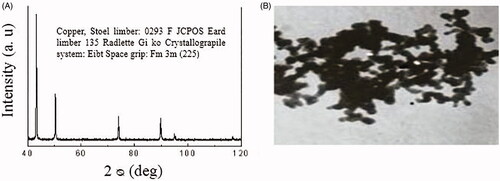
Figure 2. Standard curve for cellular uptake of copper oxide nanoparticles (CuO NPs) into the MCF-7 cells in concentrations of 25, 50 and 100 μg/mL.
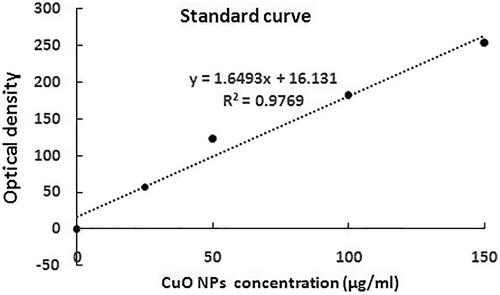
Figure 3. Effects of radiation (R), hyperthermia (H), copper oxid nanoparticle (CuO NPs) and doxorubicin, as positive control (PC), on the cell viability of MCF-7 cells in the studied groups. The abbreviations are provided in experiment design of section “Materials and methods”. The values were normalized to those of negative control group. Significant statistical differences between groups in each index are indicated by the different superscript letter (p < .05).
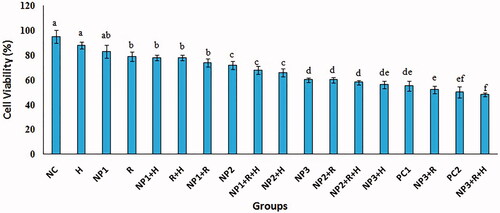
Figure 4. The effect of CuO NPs on MCF-7 cell line. The IC50 was calculated based on the linear regression.
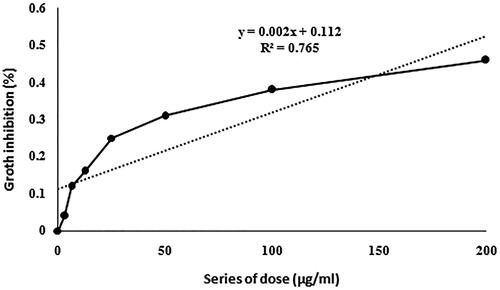
Figure 5. The assessment of MCF-7 apoptosis by propidium iodide/acridine orange staining. The green cells with diffused chromatin are viable (A), the cells with condensed chromatin are apoptotic (B) and the red cells with no condensed chromatin are necrotic (C).
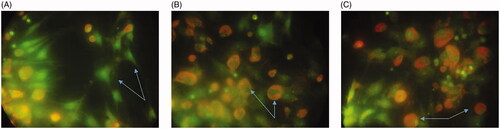
Table 1. Mean ± standard deviations (SD) of investigated parameters in the groups under study.
Table 2. Descriptive statistics (mean ± standard deviations (SD)) of investigated of caspase-3, -8, and -9 activities in the groups under study.