
Figures & data
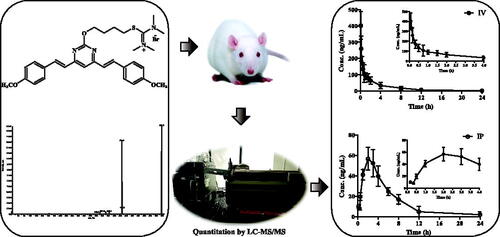
Figure 1. Chemical structure of curcumin.
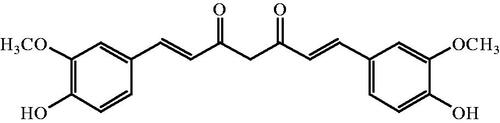
Figure 2. Chemical structures of 1G (A) and IS (B).
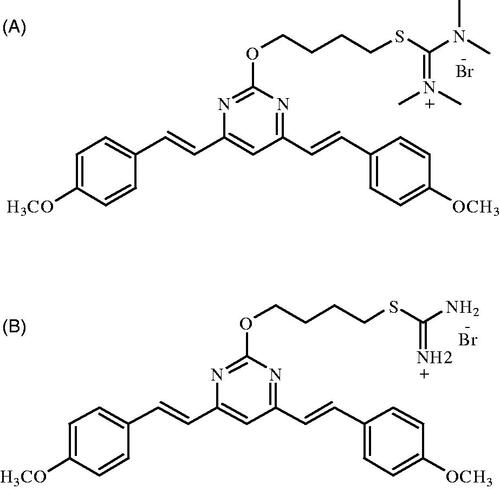
Figure 3. Product ion mass spectrum of 1G (A) and IS (B).
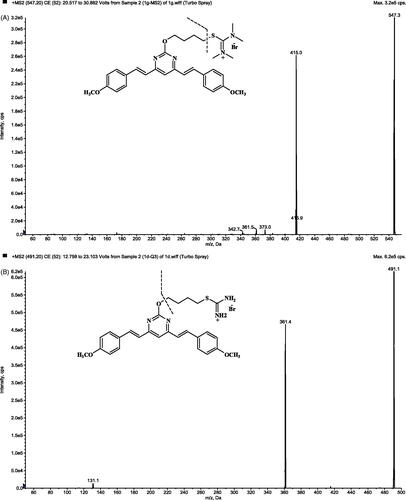
Figure 4. Representative MRM chromatograms of 1G (1) and IS (2) in rat plasma samples: (A) blank plasma sample; (B) blank plasma sample spiked with 1G (5 ng/mL, LLOQ) and IS (100 ng/mL); and (C) plasma sample at 10 min after an intravenous administration of 5 mg/kg 1G.
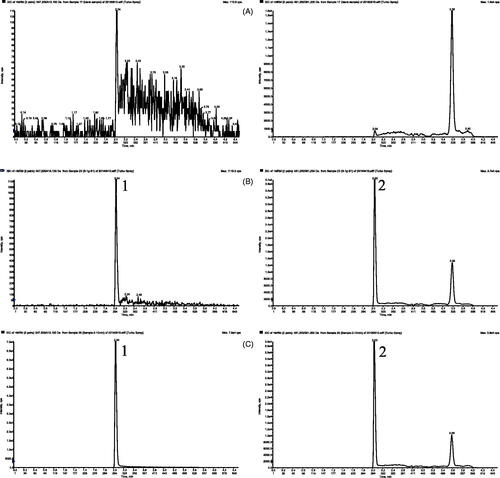
Table 1. Intra- and inter-day precision and accuracy of the method for 1G in rat plasma (n = 5).
Table 2. Recovery and matrix effect of the method for 1G and IS in rat plasma (n = 5).
Table 3. Stability of the method for 1G in rat plasma (n = 5).
Figure 5. Mean concentration–time curves of 1G following single-dose intravenous administration (A) and intraperitoneal injection (B) at 5 mg/kg in rats (mean ± SD, n = 6).
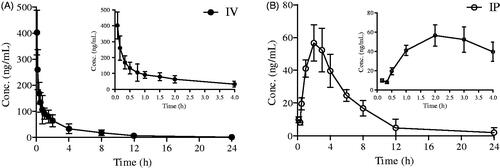
Table 4. Pharmacokinetic parameters of 1G following single-dose intravenous administration and intraperitoneal injection at 5 mg/kg in rats (n = 6).