Figures & data
Table 1. Primer sequences used in qRT-PCR.
Figure 1. Colour change during nanoparticle synthesis. (From left to right: initial time, AgClNPs and AgNPs).
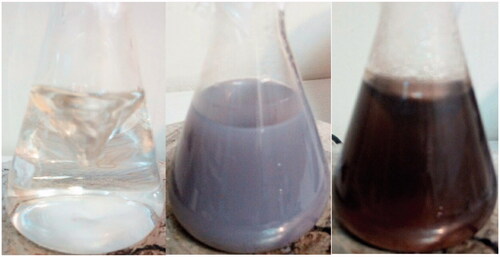
Figure 2. FESEM image of the synthesized AgClNPs. As seen, the nanoparticles have a spherical shape with a size around 13 nm in diameter.
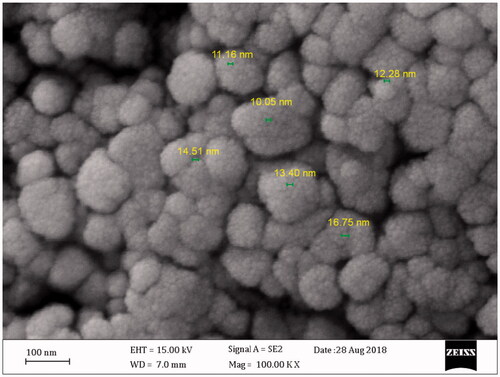
Figure 3. Energy dispersive spectroscopy (EDS) analysis of the synthesized nanoparticles (Double repeat).
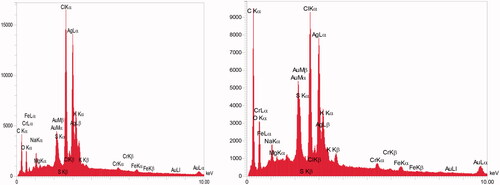
Figure 4. The XRD spectrum of synthesized AgClNPs.
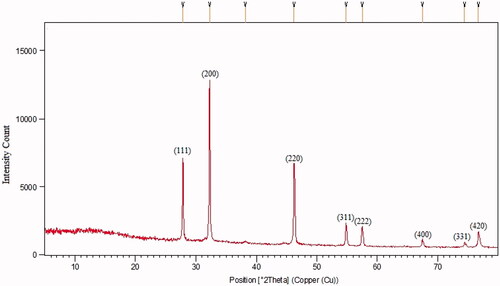
Figure 5. Cytotoxicity measurement of MCF-7 (Tumor cell line) and HEK293 (Non-tumor cell line) after 24 h incubation with AgClNPs. Data are represented as mean ± SD. Asterisks (*) indicate a significant difference with the control group (*p < .05, **p < .01, ***p < .001).
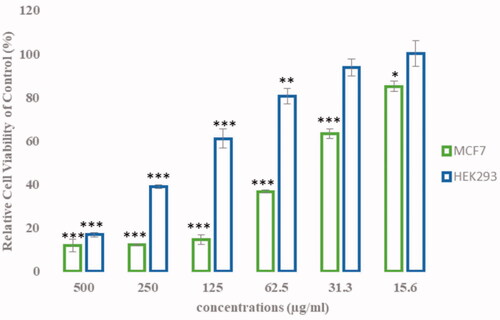
Figure 6. Transcriptional analysis of genes involved in the cell death induced by a medium dose of AgClNPs after 24 h. Data are normalized to the untreated cells and reported as mean ± SD. Asterisks (*) indicate a significant difference with the control group (*p < .05, **p < .01, ***p < .001).
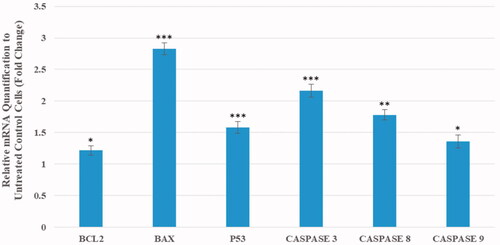
Figure 7. Caspase activity measurements in MCF-7 cells after 24 h of incubation with AgClNP at a medium dose (44 μg/mL). Data are normalized to the untreated cells and reported as mean ± SD. Asterisks (*) indicate a significant difference with the control group (***p < .001).
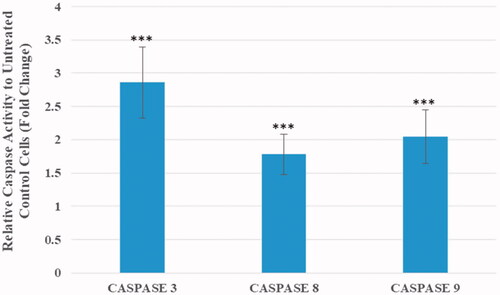
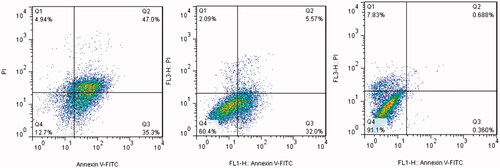
Figure 8. Flow cytometric analysis of MCF-7 cells treated with different concentrations of AgClNPs after 24 h of incubation. (Right) untreated cells, (Middle) cells treated with a medium dose (44 μg/mL), and (Left) cells treated with a high dose (150 μg/mL).