Figures & data
Figure 1. ERα as a target of E2 to affect AQP7 upon steatosis in HepG2 cells. ORO staining (A) and triglyceride level (B) in different treatment of HepG2 cells. The protein levels of AQP7, ERs, ACC, FAS and GPAT in different treatment of HepG2 cells (C). ERα enrichment on AQP7 promoter region in different treatment of HepG2 cells using ChIP-qPCR assay (D). Each experiment was repeated three individual times and represent mean ± SD. “*” and “**” means p values less than .05 and .01.
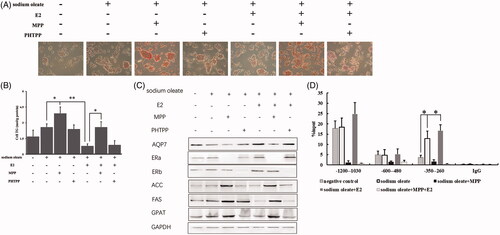
Figure 2. The mRNA profiles of HepG2 cells with different treatment. Heatmap (A) and venn diagram (B) of genes with differential expression upon sodium oleate, E2 and ERα silencing. Gene ontology analysis of the differential expressed genes (C). sodium oleate group vs sodium oleate plus E2 (left) and sodium oleate plus E2 vs sodium oleate, E2 plus ERα silencing (right). KEGG analysis of the differential expressed genes (D). sodium oleate group vs sodium oleate plus E2 (left) and sodium oleate plus E2 vs sodium oleate, E2 plus ERα silencing (right). The qPCR validation of RNA-Seq (E). Each experiment was repeated three individual times and represent mean ± SD. “*” and “**” means p values less than .05 and .01.
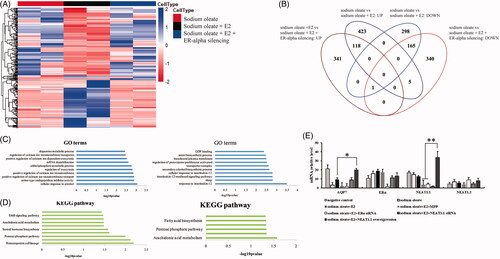
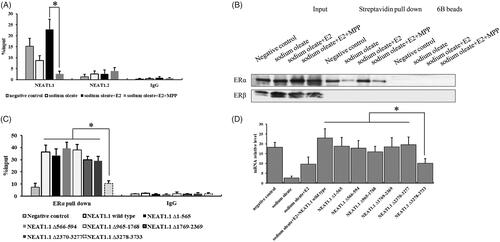
Figure 3. The interaction between NEAT1.1 and ERα. RIP (A) and RNA pull down assay (B) for the interaction between NEAT1.1 and ERα. The binding domain of NEAT1.1 interacting with ERα by truncation assay (C). The transcriptional activity of AQP7 upon over-expression of different truncated NEAT1.1 (D). Each experiment was repeated three individual times and represent mean ± SD. “*” means p values less than .05.