
Figures & data
Figure 1. The expression of LINC-PINT in NSCLC. (A) The level of LINC-PINT in NSCLC tissues (n = 36) compared with adjacent non-tumour tissues was assessed by qRT-PCR. (B) The relative level of LINC-PINT was assessed by qRT-PCR in NSCLC cell lines and BEAS-2B cell. *P < .05, **P < .01.
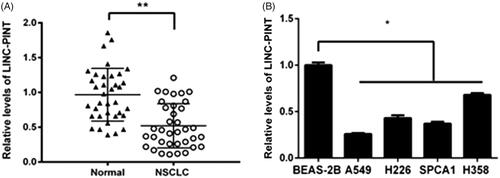
Figure 2. LINC-PINT inhibits NSCLC cell proliferation and cell cycle. (A) The level of LINC-PINT in NSCLC cell transfected with pcDNA-LINC-PINT or pcDNA-NC were analyzed by qRT-PCR. (B) The effect of LINC-PIN on A549 cell proliferation was evaluated by CCK8 assay. (C) The effect of LINC-PIN on A549 cell cycle was determined by flow cytometry. *P < .05, **P < .01.
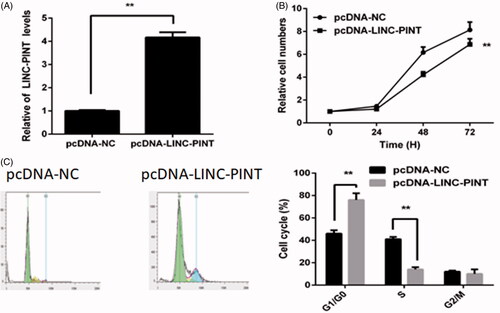
Figure 3. LINC-PINT inhibits NSCLC cell migration and invasion. (A) The effect of LINC-PINT on A549 cells migratory capacity was investigated by transwell assay. (B) The effect of LINC-PINT on A549 cells invasive capacity was conducted by Matrigel invasion assay. *P < .05, **P < .01.
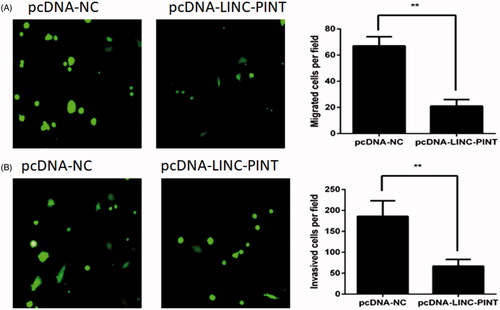
Figure 4. miR-338-3p targets LINC-PINT in A549 cell. (A) The location of LINC-PINT in the A549 cell cytoplasm and nucleus were assessed by qRT-PCR. (B) Luciferase activity was measured in A549 cell by transfected with miR-338-3p, miR-NC mimic, WT-LINC-PINT and MT-LINC-PINT plasmid. (C) The RIP assay showed that both miR-338-3p and LINC-PINT were enriched in A549 cell. (D) The level of miR-338-3p was detected in A549 cell transfected with pcDNA-LINC-PINT or pcDNA-NC by qRT-PCR. (E) The expression of LINC-PIN was detected in A549 cell transfected with miR-NC, miR-338-3p mimic, miR-338-3p inhibitor and anti-miR-NC by qRT-PCR. (F) The level of miR-338-3p was detected in NSCLC samples and adjacent normal samples by qRT-PCR. (G) The level of miR-338-3p was detected in NSCLC cell lines and BEAS-2B cell by qRT-PCR. (H–K) Cell proliferation, cell cycle, migration and invasion were detected in A549 cells transfected with pcDNA-LINC-PINT and miR-338-3p mimic. *P < .05, **P < .01.
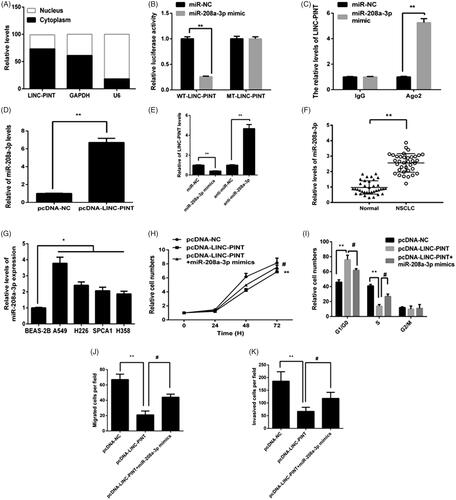
Figure 5. PDCD4 targets LINC-PINT in A549 cell. (A) The expression of PDCD4 was detected in A549 cell transfected with miR-NC, miR-338-3p mimic, miR-338-3p inhibitor and anti-miR-NC by qRT-PCR. (B) The level of PDCD4 was detected in A549 cell transfected with pcDNA-LINC-PINT and miR-338-3p mimic by qRT-PCR. (C–F) Cell proliferation, cell cycle, migration and invasion were detected in A549 cells transfected with pcDNA-LINC-PINT and PDCD4 inhibitor. *P < .05, **P < .01.
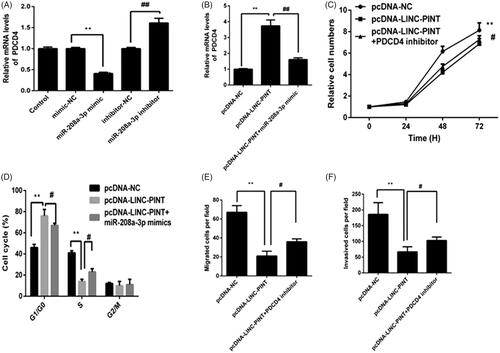
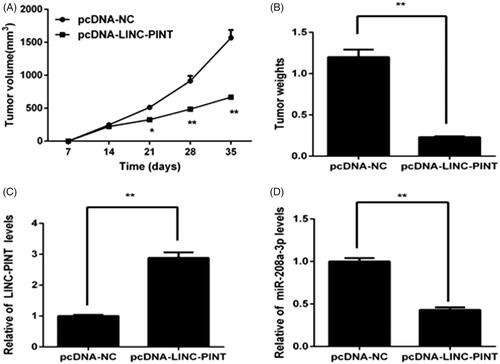
Figure 6. LINC-PINT inhibits the tumourigenesis of NSCLC in vivo. (A, B) The volume and weights of tumour was determined after transfected pcDNA-LINC-PINT or pcDNA-NC for 35 days. (C) The level of LINC-PINT in xenograft tumours were analyzed by qRT-PCR. (D)The level of miR-338-3p in xenograft tumours were analyzed by qRT-PCR. *P < .05, **P < .01.
Availability of data and materials
The datasets supporting the conclusions of this article are included within the article.