Figures & data
Figure 1. Overexpressed UCA1 induces cell proliferation and knockdown of UCA1 suppresses cell proliferation and promotes cell apoptosis. One group of TPC-1 cells were transfected with pcDNA3.1 or pc-UCA1, with left untreated as the control. The other group was transfected with si-NC or si-UCA1 or left untreated as the control. (A and B) UCA1 in TPC-1 cells was evaluated through qRT-PCR. (C and D) CCK8 assay was used to examine cell viability. (E-H) The expression of CyclinD1, CDK4, CDK6 in TPC-1 cells was valued through immunoblotting. β-Actin was used as an internal control. (I and J) Apoptosis progress was examined through flow cytometry analysis. (K and L) Cell apoptosis-related proteins were examined through immunoblotting. β-Actin served as a reference. The bars showed means ± SD (n = 3). *p < .05 or **p < .01 compared with pcDNA3.1 group.
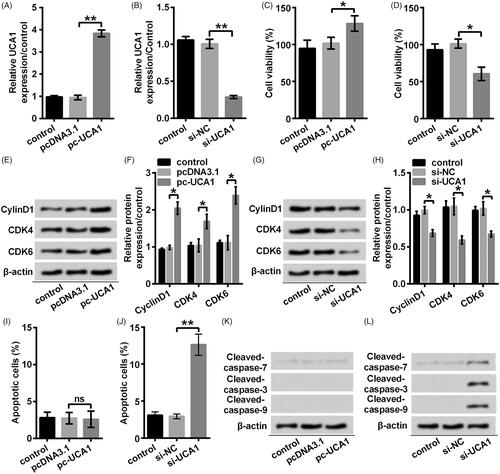
Figure 2. Overexpressed UCA1 promoted EMT in TPC-1 cells. TGF-β1 was used here as an EMT inducer to observe more obvious results. (A and C) The expression of EMT associated proteins was examined through immunoblotting. β-Actin served as an internal control. (B and D) Statistical analysis of the level of E-cadherin, Vimentin, Snail and ZEB1 was presented as column diagram. The bars showed means ± SD n = 3). *p < .05 compared with pcDNA3.1 group.
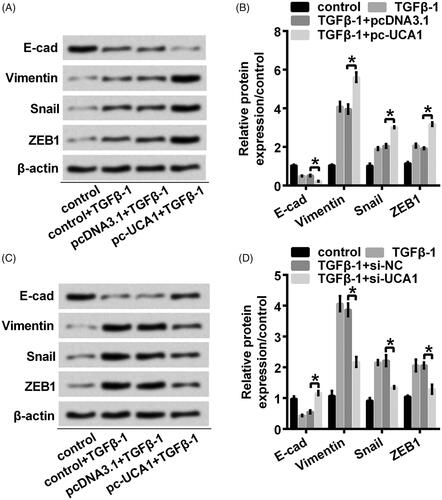
Figure 3. Overexpressed UCA1 promoted cell proliferation and EMT through down-regulating the level of miR-15a. (A) TPC-1 cells were transfected with pcDNA3.1 or pc-UCA1 with left untreated as the control. The level of miR-15a was valued through qRT-PCR. (B) miR-15a mimic was used in the following experiments to up-regulate the level of miR-15a. The level of miR-15a was valued through qRT-PCR. (C) Apoptosis progress was examined through flow cytometry. (D and E) CyclinD1, CDK4, and CDK6 in TPC-1 cells were valued through immunoblotting. (F and G) E-cadherin, Vimentin, Snail and ZEB1 in TPC-1 cells were valued through immunoblotting. β-Actin was used as an internal control. The bars showed means ± SD (n = 3). *p < .05 or **p < .01 compared with pcDNA3.1 group; #p < .05 compared with pc-UCA1 group.
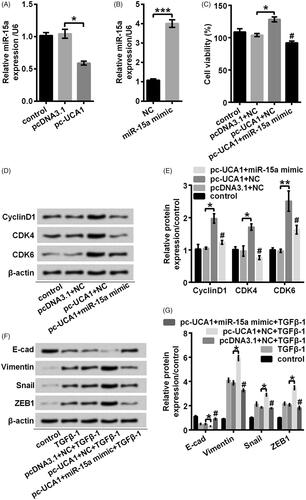
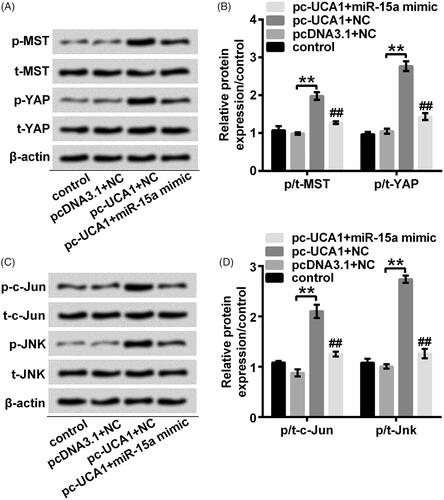
Figure 4. Overexpressed UCA1 activated the Hippo and JNK signal pathways through down-regulating the level of miR-15a. (A and B) The expression of Hippo signal pathway associated proteins p-MST, t-MST, p-YAP, t-YAP was valued through immunoblotting. (C and D) The expression of JNK signal pathway associated proteins p-c-Jun, t-c-Jun, p-JNK, t-JNK was valued through immunoblotting. The bars showed means ± SD (n = 3). **p < .01 compared with pcDNA3.1 group; ##p < .01 compared with pc-UCA1 group.