Figures & data
Figure 1. Synthesis scheme of FG-C18.
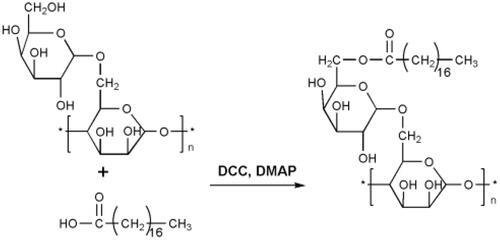
Figure 2. FTIR of FG (a), FG-C18 (b) and Stearic acid (c).
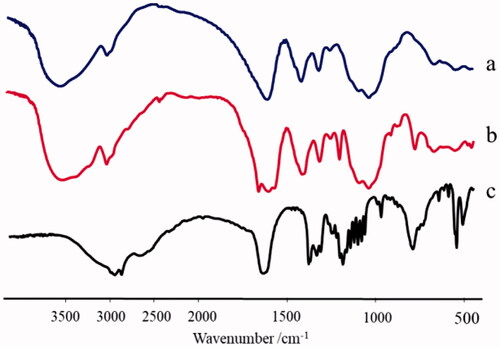
Figure 3. 1H- NMR spectrum of FG (a), FG-C18 (b) and stearic acid (c).
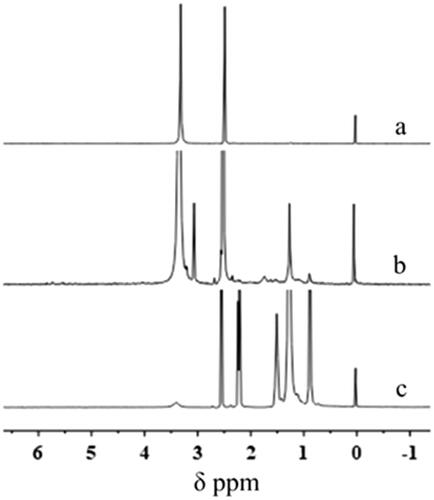
Figure 4. Appearance of FG-C18 NMs suspension (left) and FG solution (right) (a); TEM images (bar = 200 nm) (b); Size distribution (c) and Zeta potential (d) of FG-C18 NMs.
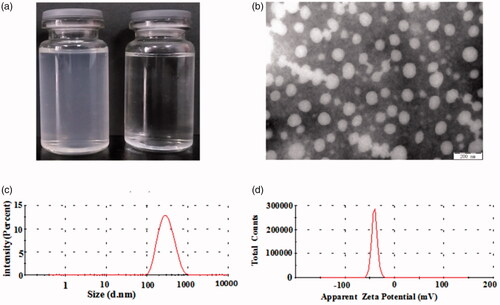
Figure 5. Storage stability of FG-C18 NMs under 4 °C and 37 °C at various time intervals.
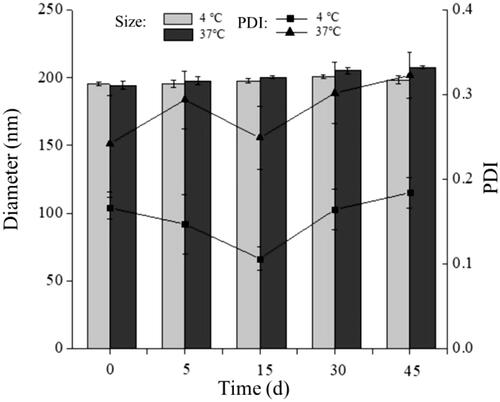
Figure 6. Fluorescence spectra for pyrene (6 × 10⁻⁷ mol/l) in FG-C18 at different concentrations (a), arrows point to minimum concentration. Pyrene intensity ratio versus the logarithm of FG-C18 concentrations (b).
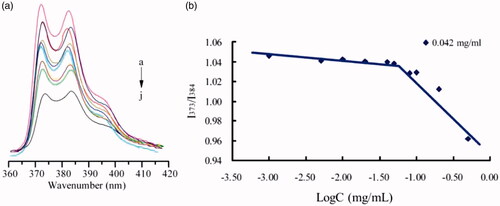
Figure 7. Haemolysis caused by different FG-C18 concentrations of 0.2, 0.4, 0.6, 0.8, 1.0, 2.0 and 4.0 mg/ml (1–7) at 0, 1, 4, 10, and 24 h (a–e, f) the red blood cells were remixed at 24 h. The vials of 8 and 9 were treated by water and normal saline, respectively.
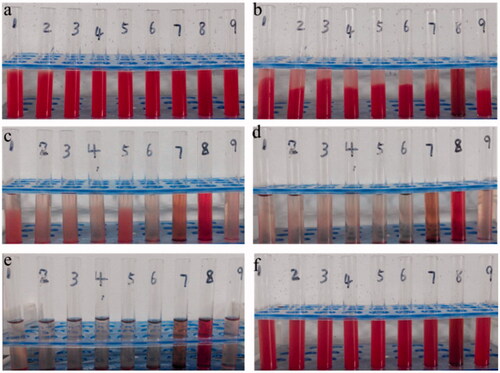
Figure 8. Haemolytic ratio of FG-C18, Cremophor EL and Tween 80 at concentrations of 0.25, 0.5 and 1 mg/ml.
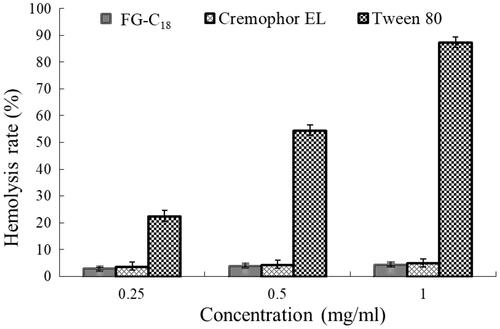
Figure 9. Cell viability assessment in HepG2 (a) and MCF-7 cells (b) treated with different FG-C18 concentration at 24, 48 and 72 h.
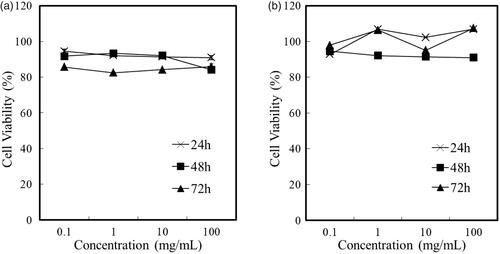
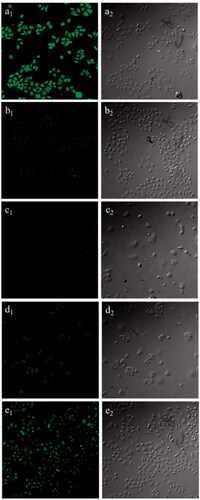
Figure 10. Fluorescence images (200×) of HepG2 cells treated with C6-FG-C18 NMs (a1) and free C6 (b1); MCF-7 cells treated with C6-FG-C18 NMs (c1) and free C6 (d1); HepG2 cells pretreated with galactose following incubation with C6-FG-C18 NMs (e1). Left and right column were confocal laser scanning microscopy images and bright field images, respectively. The C6 content in micelle solutions was 0.0382 µg/ml.