Figures & data
Figure 1. Surgical procedure of creating cartilage defect models in rabbits.
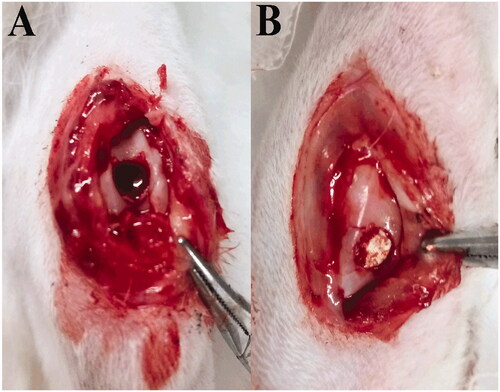
Figure 2. SEM image of the surface layer scaffold (A,B), the transition layer scaffold (C,D) and the biomimetic cartilage scaffold (E).
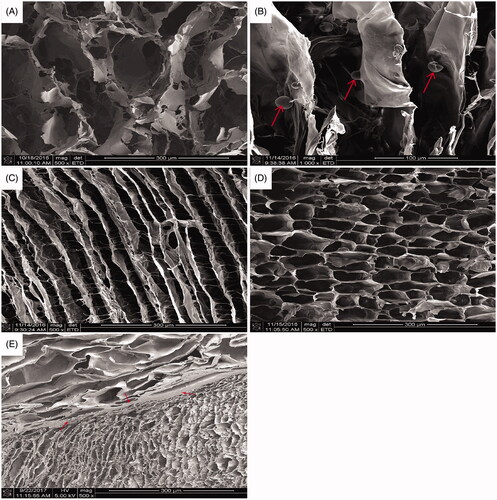
Figure 3. Compressive properties of biomimetic cartilage scaffold. The stress-strain curve of (A) dry and wet biomimetic cartilage scaffolds; Compressive strength and elastic modulus of (B) dry and wet biomimetic cartilage scaffolds (n = 3, ***p < .001).
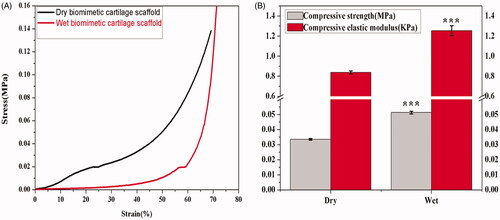
Figure 4. Cell proliferation of scaffolds (n = 3, *p < 0.05, **p < 0.01, ***p < 0.001).
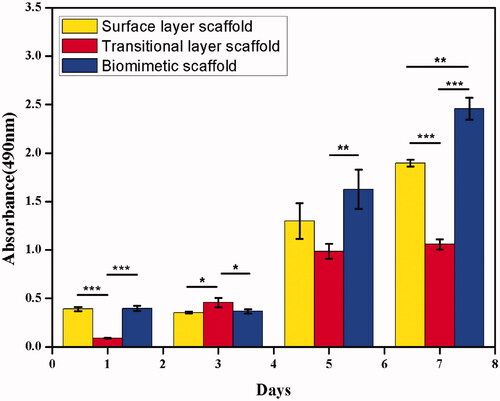
Figure 5. mBMSCs stained by AO–EB in leach liquor of the surface layer, the transition layer and the biomimetic cartilage scaffold at 1, 3, 5, 7 days (bar = 100 μm).
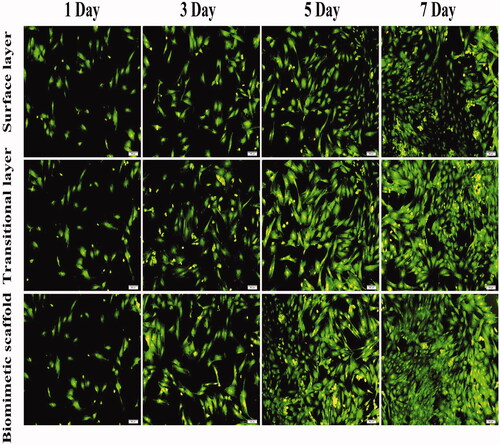
Figure 6. Gross observation on the knee joints of rabbits at different time points. The surface layer group, transitional layer group and biomimetic scaffold group were observed at 4, 8, 12 and 16 weeks after operation respectively.
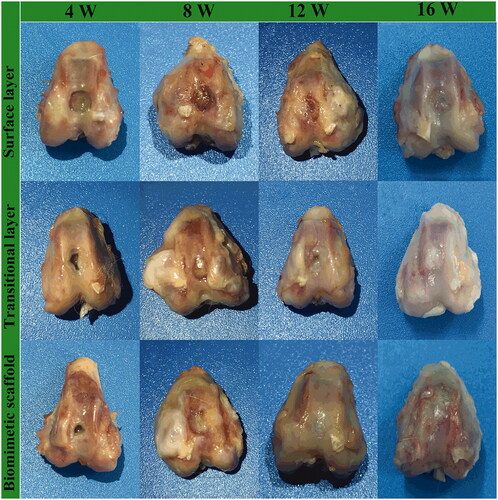
Figure 7. HE staining result of the defect at 4, 8, 12 and 16 weeks after operation.
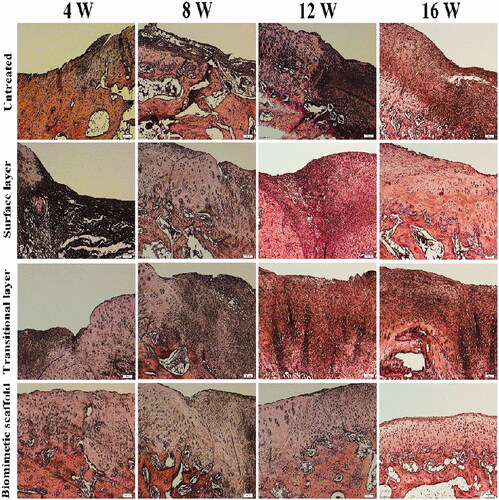
Figure 8. Alcian blue staining result of the defect at 4, 8, 12 and 16 weeks after operation.
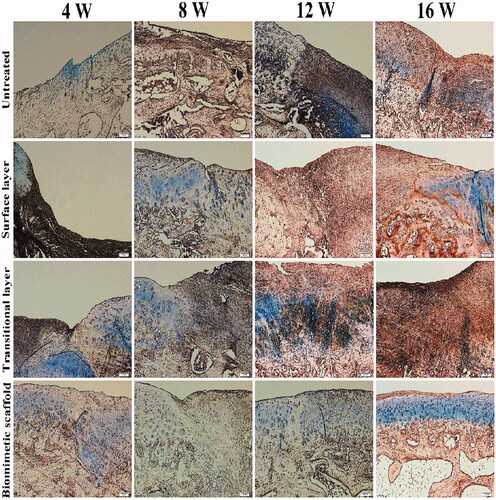
Figure 9. Toluidine blue staining result of the defect at 4, 8, 12 and 16 weeks after operation.
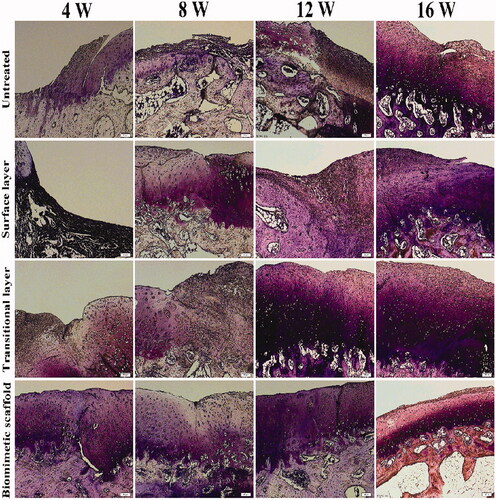
Figure 10. Safranin O-fast green staining of repaired cartilages in different groups after 4, 8, 12 and 16 weeks.
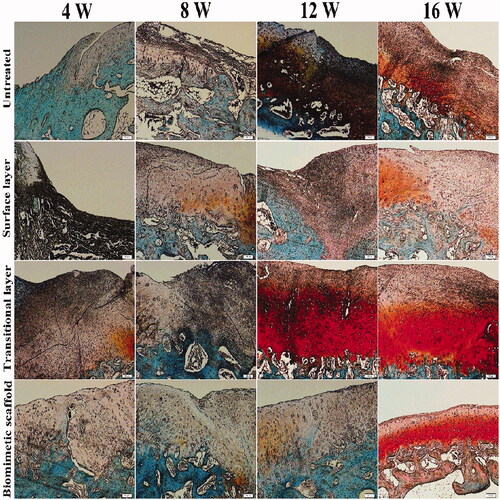
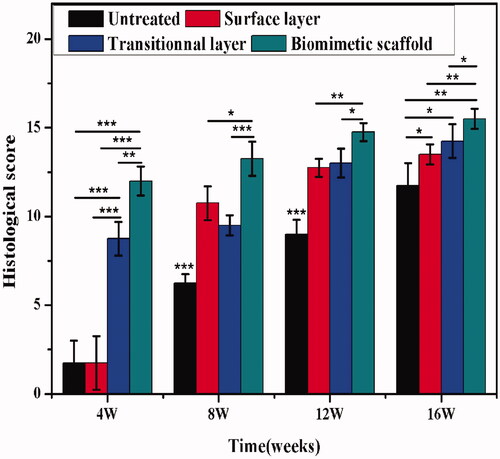
Figure 11. Histological score chart of the defect recovery of cartilage at 4, 8, 12, 16 weeks after operation.