Figures & data
Figure 1. Chemical structure of Quercetin and its effect on the cellular viability. (A) Chemical structure of Quercetin. (B) The effect of Quercetin on the cell viability in different groups. ***p < .001 comparing with the CSE-treated group.
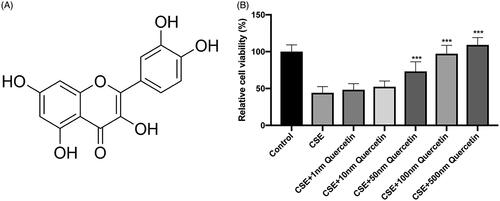
Figure 2. Quercetin protects RPE cells from CSE-induced apoptosis. (A) Control group, (B) CSE-treated group. (C) Quercetin and CSE-treated group.
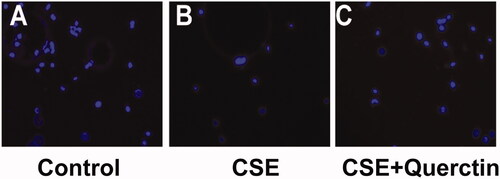
Figure 3. Quercetin protect CSE-induced inflammation in human RPE cells. (A) The expression of IL-1β in each group. (B) The expression of IL-6 in each group. (C) The expression of IL-8 in each group. (D) The expression of MCP-1 in each group. ***p < .001 comparing with the CSE-treated group.
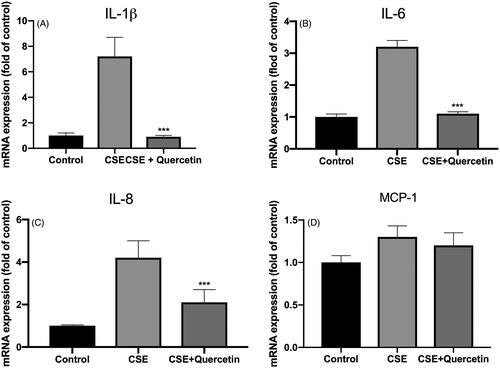
Figure 4. Quercetin protect CSE-induced oxidative stress in human RPE cells. (A) The expression of MDA in each group. (B) The expression of SOD in each group. (C) The expression of GSH in each group. (D) The expression of MCP-1 in each group. *p < .05 comparing with the CSE-treated group. ***p < .001 comparing with the CSE-treated group.
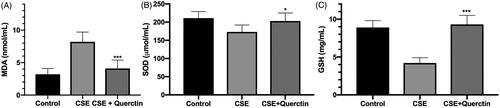
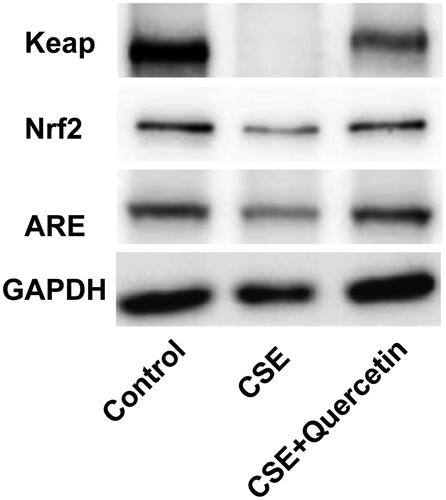
Figure 5. Effects of treatment with Quercetin on the expression levels of Keap1/Nrf2/ARE pathway in different groups.