Figures & data
Figure 1. Syntheses and properties of Co-SLD. (A) The structure and synthetic route for Co-SLD. (B) The typical changes in the electronic spectrum of myoglobin as CO releasing from compounds (myoglobin binds one CO to form carbonyl myoglobin). (C) The effect of compound concentration on COX-2 in CAL27. Each value is expressed as the mean ± SEM (n = 3). **p < .01 and ***p < .001 compared with the control group.
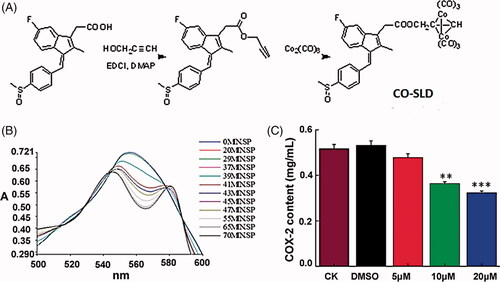
Figure 2. Embryo development toxicity caused by Co-SLD in vivo. (A) The mortality rate of zebrafish embryos with different treatments. (B) The hatchability of zebrafish embryos with different treatments. (C) Morphological abnormalities of zebrafish with the different treatments. PE: pericardial oedema; YSE: yolk sac oedema; SB: spine flexion; TD: tail deficiency. Each value is expressed as the mean ± SEM (n = 3). **p < .01 and ***p < .001 compared with the control group.
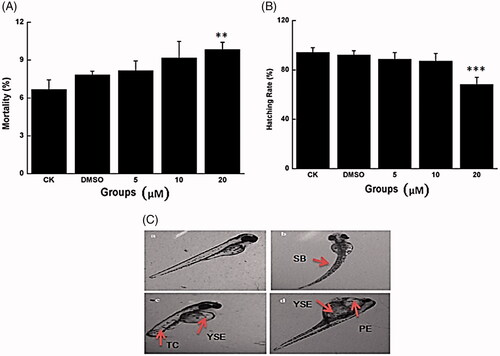
Figure 3. Changes in cardiotoxicity induced by Co-SLD at 48 hpf embryos. (A) Typical fluorescence microscope of live zebrafish embryos measured using AO staining. Apoptosis cells were identified as green punctate dots on a black background and indicated by white arrows. (B) The heart rate at 48 hpf zebrafish with the different treatments. Each value is expressed as the mean ± SEM (n = 3). *p < .05 compared with the control group.
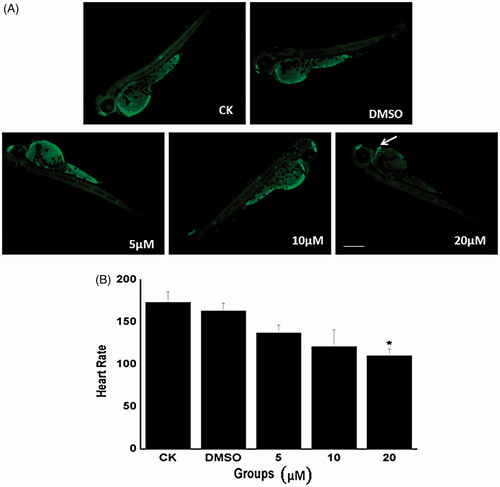
Figure 4. Behavioural assessment with the increasing concentrations of Co-SLD treatments. (A) Spontaneous movement at 24 hpf zebrafish embryos (B) Swimming distances of larvae after a 30-min light-to-dark photostimulation at 144 hpf. Light and dark periods are denoted by white and dark bars at the bottom. Each value is expressed as the mean ± SEM (n = 3). *p < .05, **p < .01 and ***p < .001 compared with the control group.
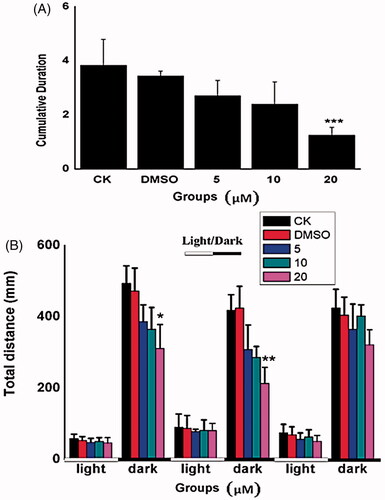
Figure 5. Inhibition of CAL27 cell growth of Co-SLD. (A) Capture images of Ki67 as a proliferation mark with a fluorescent confocal microscope. (B) Monitors of cell growth up to 96 h using the RTCA system. (C–D) Representative images of the colony formation and quantitative colony counts. Each value is expressed as the mean ± SEM (n = 3). ***p < .001 compared with the control group.
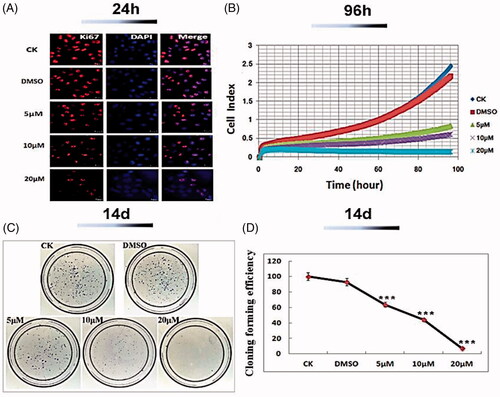
Figure 6. Alterations of cell cycle and apoptosis induced by Co-SLD. (A) Analysis of cell cycle distribution of CAL-27 cells in G1, S and G2 cell cycle stage. (B) Percentage denotes the proportion of apoptotic cells in right lower quadrant and right upper quadrant. Each value is expressed as the mean ± SEM (n = 3). *p < .05 and ***p < .001 compared with the control group.
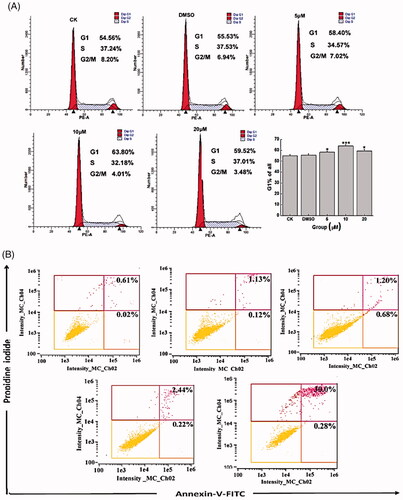
Figure 7. Treatment with Co-SLD affected the migratory potency of cells using scratch wound healing at varying time points. (A) Representative micrographs. (B) Statistical analysis for wound areas is expressed as the mean ± SEM (n = 3).
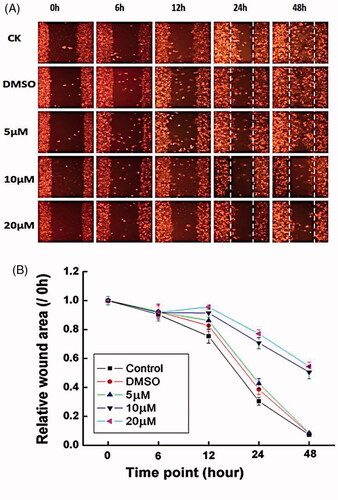
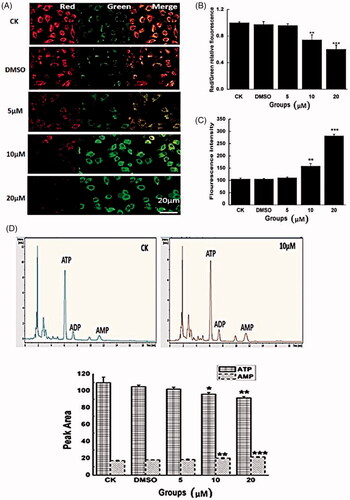
Figure 8. Modulation of mitochondrial function by Co-SLD. (A–B) Average ratios of fluorescence amplitudes measured in the red and the green fluorescence channel, as expressed by red/green ratios. (C) Statistical analysis for ROS generation by Amplex Red. (D) The levels of AMP, ADP, and ATP as a function of energy charge were determined by HPLC. Each value is expressed as the mean ± SEM (n = 3). *p < .05, **p < .01 and ***p < .001 compared with the control group.