Figures & data
Figure 1. Salicin ameliorates IL-1β-induced oxidative stress in human primary retinal endothelial cells (RECs). (A) The cellular reactive oxygen species (ROS) was stained by dihydroethidium (DHE); Scale bars, 100 μm. (B) The expression of NOX-4 at the mRNA levels was determined by real-time PCR. (C) The expression of NOX-4 at the protein levels was determined by western blot analysis. Cells were treated with IL-1β (10 ng/mL) in the presence or absence of salicin (50 and 100 μM) for 48 h (*, #, $, p < .01 vs. previous column group, n = 5–6).
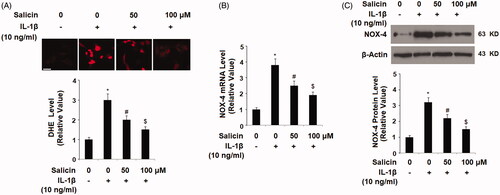
Figure 2. Salicin mitigates IL-1β-induced mitochondrial dysfunction in RECs. Cells were treated with IL-1β (10 ng/mL) in the presence or absence of salicin (50 and 100 μM) for 48 h. The levels of mitochondrial membrane potential (MMP) were determined by tetramethyl rhodamine methyl ester (TMRM) staining. Scale bars, 100 μm (*, #, $, p < .01 vs. previous column group, n = 6).
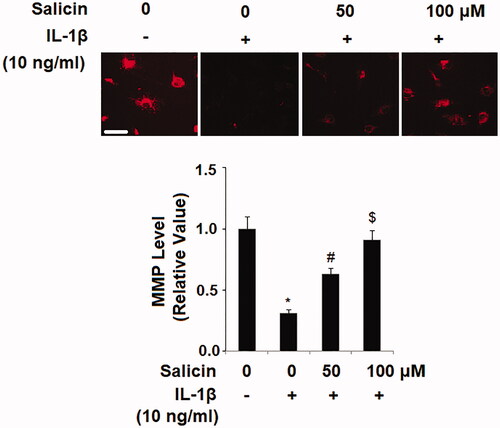
Figure 3. Salicin inhibits IL-1β-induced secretions of pro-inflammatory cytokines in RECs. (A) Expressions of TNF-α, IL-6, and MCP-1 at the mRNA levels were determined by real-time PCR analysis. (B) Secretions of TNF-α, IL-6, and MCP-1 were determined by ELISA respectively. Cells were treated with IL-1β (10 ng/mL) in the absence or presence of salicin (50 and 100 μM) for 48 h (*, #, $, p < .01 vs. previous column group, n = 5–6).
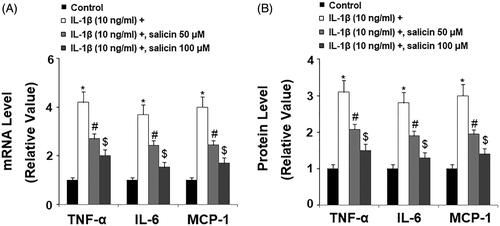
Figure 4. Salicin reduces IL-1β-induced secretions of high-mobility group protein 1 (HMGB-1) in RECs. Cells were treated with IL-1β (10 ng/mL) in the absence or presence of salicin (50 and 100 μM) for 48 h. Secretions of HMGB-1 were determined by ELISA (*, #, $, p < .01 vs. previous column group, n = 6).
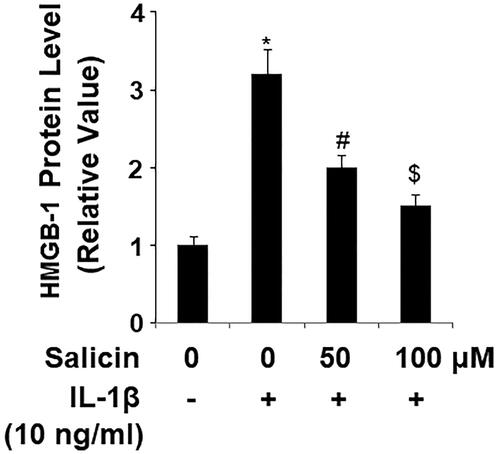
Figure 5. Salicin inhibits IL-1β-induced release of lactate dehydrogenase (LDH) in RECs. Cells were treated with IL-1β (10 ng/mL) in the absence or presence of salicin (50 and 100 μM) for 48 h. The release of LDH was determined using a commercial kit (*, #, $, p < .01 vs. previous column group, n = 6).
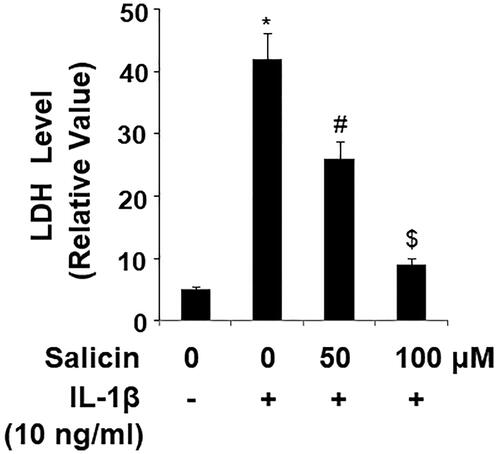
Figure 6. Salicin inhibits IL-1β-induced expression of ICAM-1 and VCAM-1 in RECs. (A) Expressions of ICAM-1 and VCAM-1 at the mRNA levels were determined by real-time PCR. (B) Expressions of ICAM-1 and VCAM-1 at the protein levels were determined by ELISA. Cells were treated with IL-1β (10 ng/mL) in the presence or absence of salicin (50 and 100 μM) for 48 h (*, #, $, p < .01 vs. previous column group, n = 5–6).
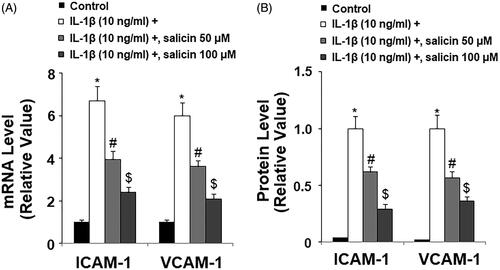
Figure 7. Salicin inhibits IL-1β-induced reduction of endothelial nitric oxide synthase (eNOS) and nitric oxide (NO). (A) The expression of eNOS at the mRNA levels was determined by real-time PCR. (B) The expression of eNOS at the protein levels was determined by western blot analysis. (C) The level of intracellular NO was determined by DAF-FM DA staining. Scale bars, 100 μm. Cells were treated with IL-1β (10 ng/mL) in the presence or absence of salicin (50 and 100 μM) for 48 h (*, #, $, p < .01 vs. previous column group, n = 5–6).
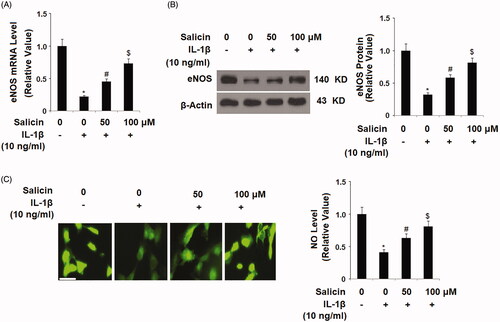
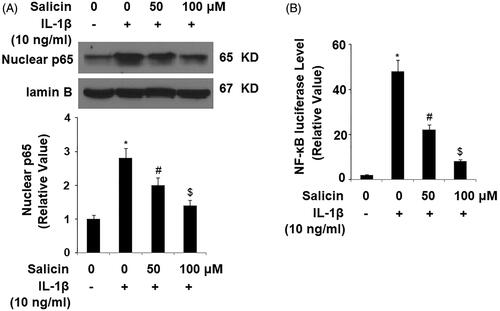
Figure 8. Salicin inhibits IL-1β-induced activation of the NF-κB signaling. (A) Nuclear levels of p65 were determined by western blot analysis. (B) NF-κB luciferase activities were measured. Cells were treated with IL-1β (10 ng/mL) in the absence or presence of salicin (50 and 100 μM) for 48 h (*, #, $, p < .01 vs. previous column group, n = 5–6).