Figures & data
Figure 1. High expression of SBF2-AS1 in AML. (A, B) SBF2-AS1 expression in AML samples (n = 173) and normal samples (n = 70) from GEPIA analysis. (C) The survival curves of AML patients from GEPIA analysis. (D) qRT-PCR analysis for SBF2-AS1 expression in AML cell lines (THP‐1, U937 and HL60). *p < .05.
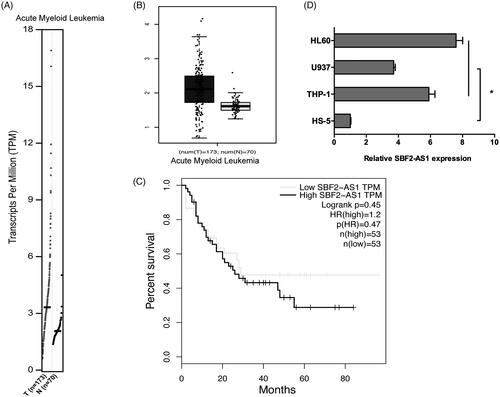
Figure 2. SBF2-AS1 inhibition decreases AML cells proliferation. (A) qRT-PCR analysis for SBF2-AS1 knockout efficiency in THP‐1 and HL60 cells. (B) CCK-8 assay showed that si-SBF2-AS1 significantly decrease AML cells proliferation ability. (C) Flow cytometry analysis revealed that SBF2-AS1 inhibition induced AML cells apoptosis. (D) Flow cytometry analysis showed that SBF2-AS1 inhibition arrested AML cells in G0/G1 phase. *p < .05.
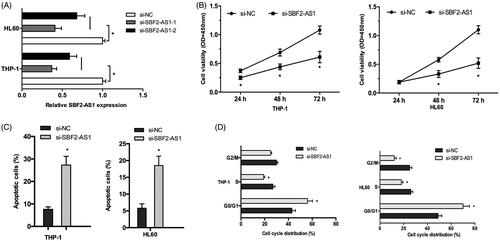
Figure 3. SBF2-AS1 binds to miR-188-5p in AML. (A) The schematic diagram of SBF2-AS1 with miR-188-5p binding sites. (B) Luciferase reporter assay showed that luciferase activity was significantly decreased by co-transfection with miR-188-5p mimics and SBF2-AS1-Wt vector. (C) QRT-PCR showed that SBF2-AS1 inhibition decreased miR-188-5p expression in AML cells. (D) RIP assay revealed that both SBF2-AS1 and miR-188-5p expression were highly enriched in Ago2 immunoprecipitates. (E) CCK-8 assay showed that mIR-188-5p inhibitors reversed the effects of SBF2-AS1 knockdown on AML cells proliferation. *p < .05.
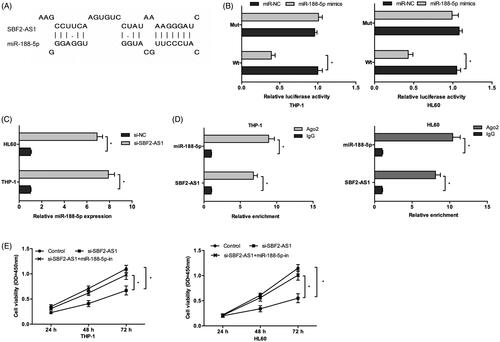
Figure 4. ZFP91 is a direct target of miR-188-5p. (A) The schematic diagram of ZFP91 with miR-188-5p binding sites. (B) Luciferase reporter assay showed that miR-188-5p mimics significantly decreased the luciferase activity of ZFP91-Wt but not ZFP91-Mut. (C, D) MiR-188-5p mimics greatly downregulated ZFP91 expression in AML cells. *p < .05.
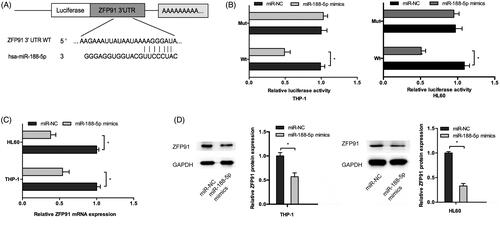
Figure 5. SBF2-AS1 modulates ZFP91 activity through miR-188-5p. (A, B) ZFP91 expression in AML samples (n = 173) and normal samples (n = 70) from GEPIA analysis. (C) ZFP91 expression was positively correlated with SBF2-AS1 expression in AML samples. (D) QRT-PCR analysis for ZFP91 expression in AML cell lines (THP‐1, U937, and HL60). (E, F) SBF2-AS1 inhibition significantly decreased ZFP91 expression both in mRNA and protein levels in AML cells, and the inhibitory effects could be reversed by miR-188-5p inhibitors. *p < .05.
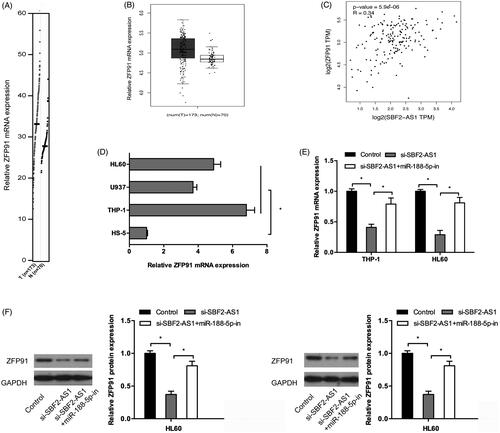
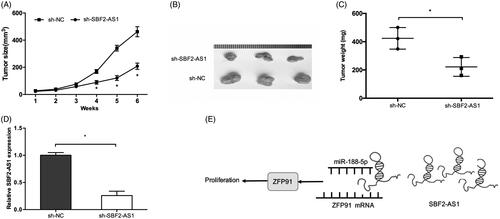
Figure 6. SBF2-AS1 promotes tumor growth in vivo. (A, B) SBF2-AS1 silencing suppressed tumor growth in vivo. (C) The tumor weight of nude mice was measured. (D) The expression level of SBF2-AS1 in tumors of nude mice was detected by qRT-PCR. (E) A schematic diagram of SBF2-AS1/miR-188-5p/ZFP91 regulatory pathway in AML. *p < .05.