Figures & data
Figure 1. H2O2 evoked HTM cells oxidative damage. (A) After disposition with disparate concentrations of H2O2 (0-400 μM), cell viability was estimated via CCK-8. HTM cells were stimulated with 200 μM H2O2, (B) cell apoptosis, (C) pro-caspase-3, cleaved-caspase-3, pro-caspase-9 and cleaved-caspase-9, and (D) ROS production were assessed by flow cytometry, western blot and DCFH-DA staining. CCK-8: Cell Counting Kit-8; ROS: reactive oxygen species; DCFH-DA: 2,7-dichlorofluorescein diacetate; *p < .05; **p < .01; ***p < .001.
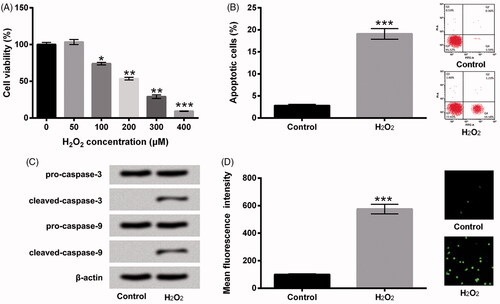
Figure 2. Sal relieved H2O2-evoked oxidative damage in HTM cells. (A) After administration with diverse concentrations of Sal (0–5 μM), cell viability was examined via CCK-8. (B) After disposition with 200 μM H2O2 and Sal (2, 3 and 4 μM), cell viability was appraised using CCK-8 again. HTM cells were stimulated with 200 μM H2O2 alone or 200 μM H2O2 + 3 μM Sal, then (C) the percentage of apoptotic cells, (D) pro-caspase-3/-9 and cleaved-caspase-3/-9, and (E) ROS production were estimated by flow cytometry, western blot and DCFH-DA staining. Sal: salidroside; CCK-8: Cell Counting Kit-8; ROS: reactive oxygen species; DCFH-DA: 2,7-dichlorofluorescein diacetate; *p < .05; **p < .01.
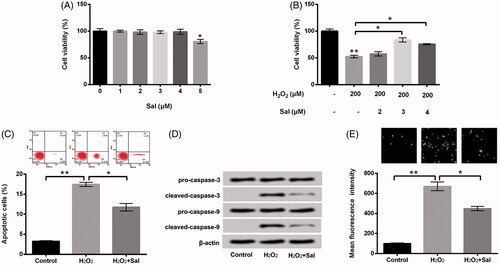
Figure 3. Sal enhanced miR-27a expression in H2O2-injured HTM cells. HTM cells were disposed with 3 μM Sal alone, 200 μM H2O2 alone or 200 μM H2O2 + 3 μM Sal, miR-27a expression was appraised via RT-qPCR. Sal: salidroside; miR-27a: microRNA-27a; RT-qPCR: reverse transcription-quantitative PCR; *p < .05; ***p < .001.
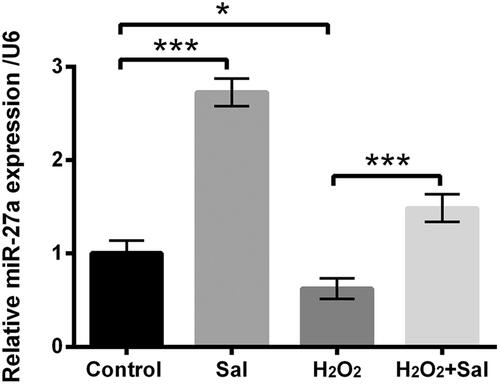
Figure 4. Repressed miR-27a hindered cell growth and elevated ROS level in HTM cells. After miR-27a inhibitor and NC transfections, (A) miR-27a expression was estimated via RT-qPCR. (B) Cell viability, (C) the percentage of apoptotic cells, (D) pro-caspase-3/-9 and cleaved-caspase-3/-9, and (E) ROS production were appraised using CCK-8, flow cytometry, western blot and DCFH-DA staining. MiR-27a: microRNA-27a; RT-qPCR: reverse transcription-quantitative PCR; CCK-8: Cell Counting Kit-8; ROS: reactive oxygen species; DCFH-DA: 2,7-dichlorofluorescein diacetate; **p < .01; ***p < .001.
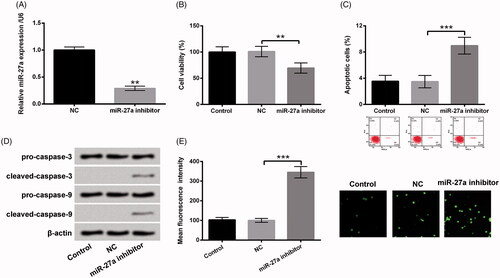
Figure 5. Sal eased H2O2-evoked oxidative damage through elevation of miR-27a in HTM cells. Transfected miR-27a inhibitor cells or NC cells were disposed with 200 μM H2O2 alone or 200 μM H2O2 + 3 μM Sal, (A) cell viability, (B) apoptosis, (C) pro-caspase-3/-9, cleaved-caspase-3/-9, and (D) ROS production were detected using CCK-8, flow cytometry, western blot and DCFH-DA staining. Sal: salidroside; miR-27a: microRNA-27a; NC: negative control; CCK-8: Cell Counting Kit-8; ROS: reactive oxygen species; DCFH-DA: 2,7-dichlorofluorescein diacetate; *p < .05; **p < .01.
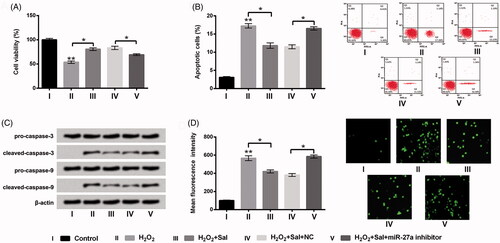
Figure 6. Repressed miR-27a blocked PI3K/AKT and Wnt/β-catenin pathways in HTM cells. HTM cells were transfected with miR-27a inhibitor and NC, (A and B) p/t-PI3K and p/t-AKT, and (C and D) β-catenin protein levels were appraised using western blot. MiR-27a: microRNA-27a; PI3K: phosphatidylinositol 3-kinase; AKT: protein kinase B; *p < .05; **p < .01.
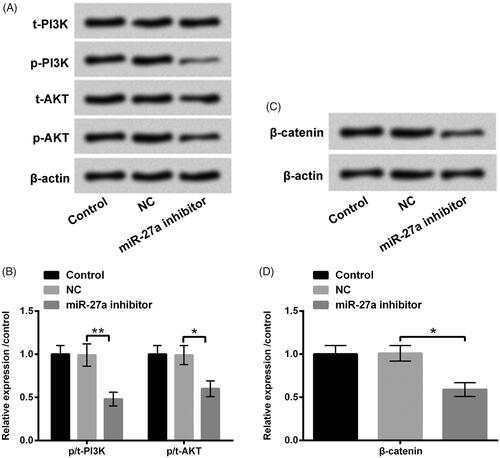
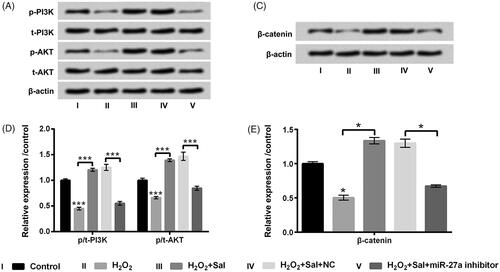
Figure 7. Sal activated PI3K/AKT and Wnt/β-catenin pathways through enhancement of miR-27a in H2O2-disposed HTM cells. After miR-27a and NC transfection, cells were disposed with 200 μM H2O2 alone or 200 μM H2O2 + 3 μM Sal, (A and B) p/t-PI3K and p/t-AKT, and (C and D) β-catenin protein levels were estimated by western blot assay. Sal: salidroside; miR-27a: microRNA-27a; PI3K: phosphatidylinositol 3-kinase; AKT: protein kinase B; *p < .05; ***p < .001.