
Figures & data
Table 1. Histological grading scale for inflammatory immune response.
Figure 1. Micrographs of PLGA nanofibrous scaffolds. (A) 10% PH group, (B) 15% PH group, (C) 20% PH group, (D) 15% PH dissolved in chloroform and DMF (V:V = 5:5), (E) 15% PH dissolved in chloroform and DMF (V:V = 7:3), (F) 15% PH dissolved in chloroform and DMF (V:V = 9:1). Black circles indicate generated fibers, blue circles indicate generated beads.
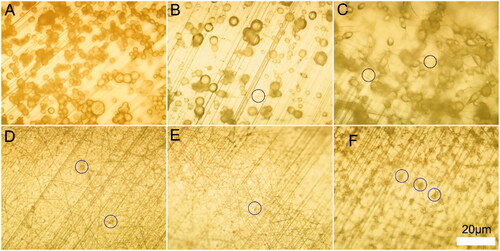
Figure 2. Characterization of Dex loaded PH nanofibrous scaffolds. (A) PH group, (B) 5% Dex loaded PH group, (C) 2% Dex loaded PH group, (D) 1% Dex loaded PH group, (E) 0.5% Dex loaded PH group, (F) 0.25% Dex loaded PH group. (G) Fiber diameter distribution of various scaffolds. Blue arrows indicate nano-hydroxyapatite aggregation.
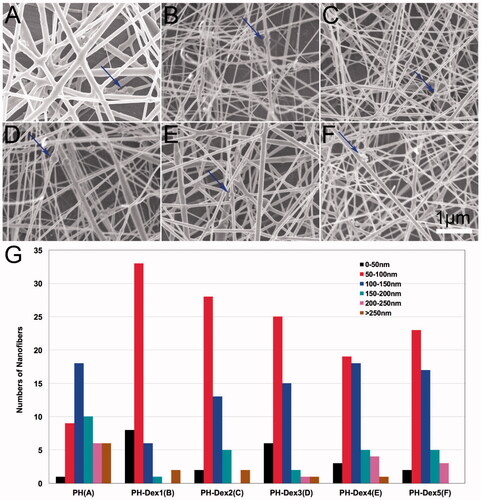
Figure 3. The cumulative Dex release profile from 5% Dex loaded PLGA/HA nanofibrous scaffold.
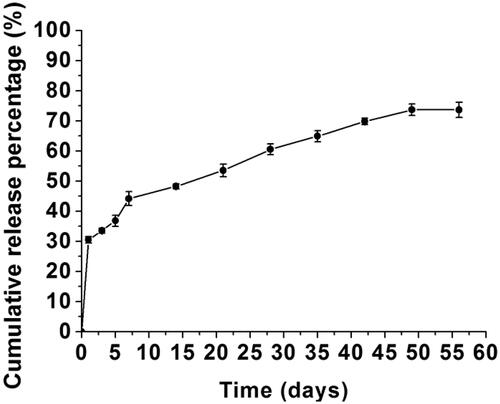
Figure 4. MC3T3-E1 cells proliferation on various scaffolds. Cont.: control group; PH: PLGA/HA group; PH-Dex1: 5% Dex loaded PH group; PH-Dex2: 2% Dex loaded PH group; PH-Dex3: 1% Dex loaded PH A group; PH-Dex4: 0.5% Dex loaded PH group; PH-Dex5: 0.25% Dex loaded PH group. ****p < .0001 vs all the other groups.
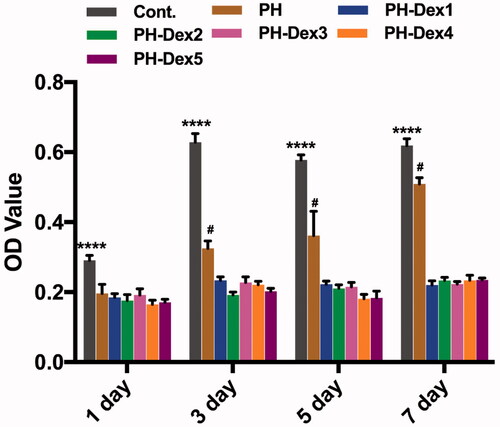
Figure 5. MC3T3-E1 cells proliferation in various Dex concentration. **p< .01; ***p< .001; ****p< .0001.
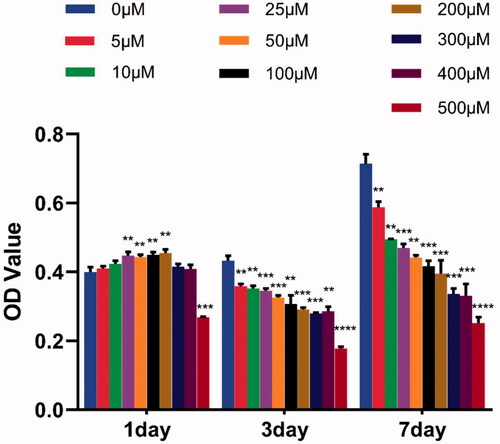
Figure 6. ALP staining of MC3T3-E1 cells on day 21. (A) Control group on tissue culture plate, (B) PH group, (C) 5% Dex loaded PH group, (D) 2% Dex loaded PH group, (E) 1% Dex loaded PH group, (F) 0.5% Dex loaded PH group, (G) 0.25% Dex loaded PH group.
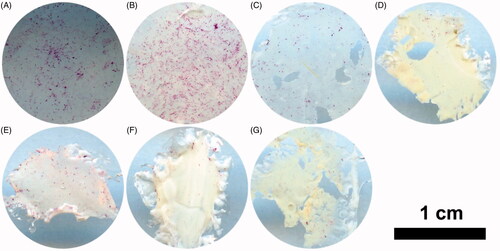
Figure 7. Mineral deposition of MC3T3-E1 cells on day 21 and quantification. (A) Control group, (B) PH group, (C) 5% Dex loaded PH group, (D) 2% Dex loaded PH group, (E) 1% Dex loaded PH group, (F) 0.5% Dex loaded PH group, (G) 0.25% Dex loaded PH group.
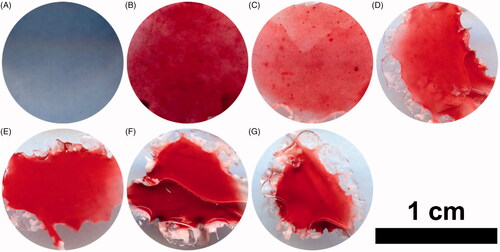
Figure 8. Histological response and grading of two scaffolds after 4-week subcutaneous implantation. (A,B) Cont. group, (C,D) PH group, (E,F) PH-Dex1 group, (G,H) PH-Dex2 group, (I,J) PH-Dex3 group, (K,L) PH-Dex4 group, (M,N) PH-Dex5 group. The right column of images (B,D,F,H,J,L,N) are the enlarged images of green rectangle box in the left column, of images (A,C,E,G,I,K,M). Green arrow: infiltrated macrophage. Black arrow: indicating fibrous capsule wall. FC: Fibrous capsule wall. S: scaffold remnants. Blue arrow: indicating area for evaluating histological response and grading.
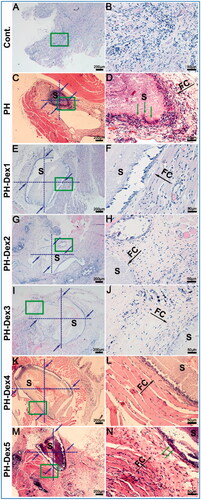
Table 2. Score of histological grading scale for inflammatory response of scaffolds.