Figures & data
Figure 1. SBD promoted PC12 cells viability after OGD/R injury. (A) PC12 cells were incubated with different concentrations of SBD (0.1–0.8 mg/ml) for 24 h. Cell viability was measured using MTT assay. (B) PC12 cells were pretreated with different concentrations of SBD (0.1–0.8 mg/ml) for 24 h and then were subjected to OGD/R injury. Cell viability was detected using MTT assay. **p < .01 compared to Normal group. ##p < .01 compared to DMSO + OGD/R group. (C) PC12 cells were pretreated with 0.4 mg/ml SBD for different times (12, 24 and 48 h), followed by OGD/R injury. Cell viability was measured using MTT assay. NS: no significance; *p < .05 compared to 12 h. Data presented as mean ± SD (n = 3).
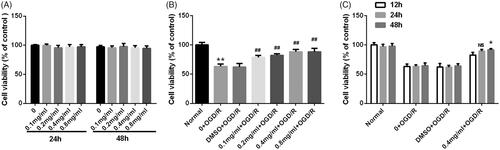
Figure 2. SBD inhibited PC12 cells apoptosis after OGD/R injury. (A and B) PC12 cells were pretreated with different concentrations of SBD (0.1–0.8 mg/ml) for 24 h and then were subjected to OGD/R injury. Apoptotic cells were detected by flow cytometry. **p < .01 compared to Normal group. ##p < .01, ###p < .001 compared to DMSO + OGD/R group. (C and D) PC12 cells were pretreated with 0.4 mg/ml SBD for different times (12, 24 and 48 h), followed by OGD/R injury. Apoptotic cells were detected using flow cytometry. *p < .05, **p < .01 compared to 12 h. Data presented as mean ± SD (n = 3).
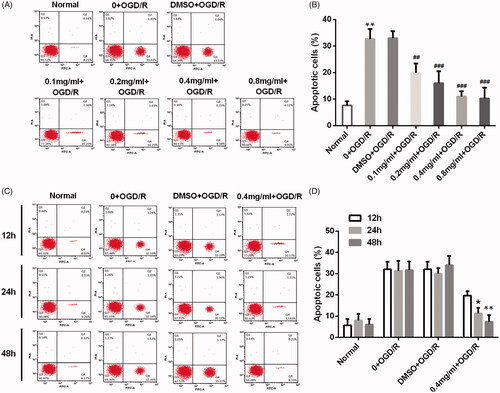
Figure 3. SBD altered the expression of pro-apoptotic proteins in PC12 cells after OGD/R injury. (A and B) PC12 cells were pretreated with different concentrations of SBD (0.1–0.8 mg/ml) for 24 h and then were subjected to OGD/R injury. Western blot was performed to assess the expression of pro-apoptotic factors. **p < .01 compared to Normal group. #p < .05, ##p < .01 compared to DMSO + OGD/R group. (C–F) PC12 cells were pretreated with 0.4 mg/ml SBD for different times (12, 24 and 48 h), followed by OGD/R injury. Western blot was performed to assess the expression of pro-apoptotic factors. **p < .01, ***p < .001 compared to 12 h. Data presented as mean ± SD (n = 3).
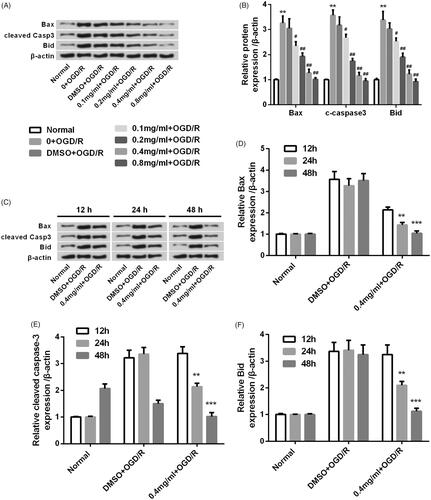
Figure 4. SBD promoted PC12 cells proliferation after OGD/R injury. (A and B) PC12 cells were pretreated with different concentrations of SBD (0.1–0.8 mg/ml) for 24 h and then were subjected to OGD/R injury. Ki67 positive cells were determined by flow cytometry. ***p < .001 compared to Normal group. #p < .05, ##p < .01, ###p < .001 compared to DMSO + OGD/R group. (C and D) PC12 cells were pretreated with 0.4 mg/ml SBD for different times (12, 24 and 48 h), and then subjected to OGD/R injury. Flow cytometric analysis was used to measure the Ki67 positive cells. NS: no significance; *p < .05 compared to 12 h. Data presented as mean ± SD (n = 3).
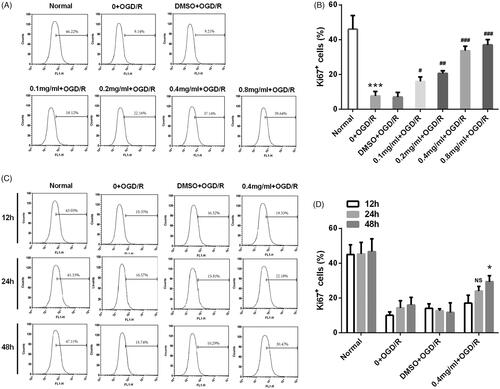
Figure 5. SBD altered the expression of proliferation-related proteins in PC12 cells after OGD/R injury. (A and B) PC12 cells were pretreated with different concentrations of SBD (0.1–0.8 mg/ml) for 24 h and then were subjected to OGD/R injury. The expression levels of proliferation-related proteins were assessed using western blot. **p < .01 compared to Normal group. NS: no significant; #p < .05; ##p < .01 compared to DMSO + OGD/R group. (C–E) PC12 cells were pretreated with 0.4 mg/ml SBD for different times (12, 24 and 48 h), and then subjected to OGD/R injury. Western blot was performed to assess the expression levels of proliferation-related proteins. NS: no significant; *p < .05; **p < .01 compared to 12 h. Data presented as mean ± SD (n = 3).
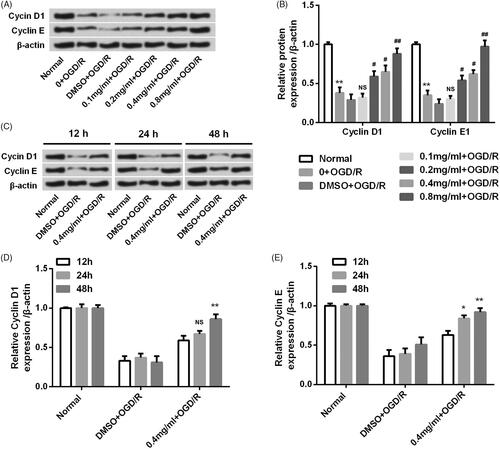
Figure 6. SBD attenuated oxidative damage and restored mitochondria dysfunction in PC12 cells after OGD/R injury. PC12 cells were pretreated with different concentrations of SBD (0.1–0.8 mg/ml) for 24 h, followed by OGD/R injury. (A) The MDA content, (B) SOD activity and (C) GSH levels were determined by special commercial assay kits. (D) The mitochondrial membrane potential (Δψm) was measured by Rh123 staining. **p < .01, ***p < .001 compared to Normal group. #p < .05, ##p < .01, ###p < .001 compared to DMSO + OGD/R group. Data presented as mean ± SD (n = 3).
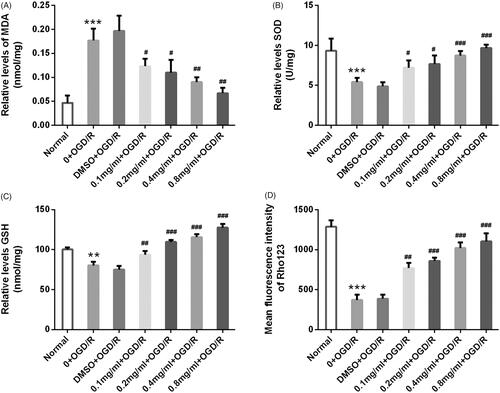
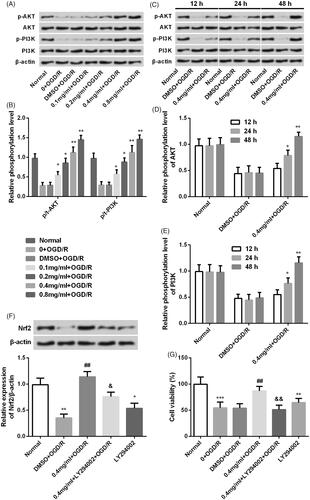
Figure 7. SBD promoted Nrf2 expression in PC12 cells. (A) PC12 cells were pretreated with different concentrations of SBD (0.1–0.8 mg/ml) for 24 h and then were subjected to OGD/R injury. The expression of Nrf2 was measured using western blot. (B) PC12 cells were pretreated with 0.4 mg/ml SBD for different times (12, 24 and 48 h) and then were subjected to OGD/R injury. The expression of Nrf2 was measured using western blot. (C) PC12 cells were transfected with siNC or siNrf2 for 48 h. The transfected efficiency was verified using western blot. Then, transfected cells were pretreated with 0.4 mg/ml SBD for 24 h, followed by OGD/R injury. (D) Cell viability was measured using MTT assay. (E and F) The expression of Nrf2 was detected using western blot. NS: no significant; *p < .05; ***p < .001 compared to the corresponding control group. NS: no significant; #p < .05; ##p < .01; ###p < .001 compared to DMSO + OGD/R group. Data presented as mean ± SD (n = 3).
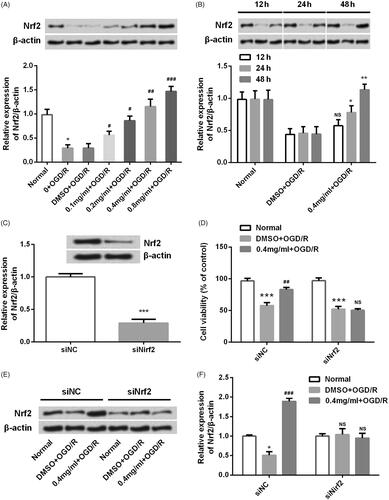
Figure 8. SBD regulated Nrf2 expression in PI3K/AKT-dependent signalling. (A and B) PC12 cells were incubated with different concentrations of SBD (0.1–0.8 mg/ml) for 24 h and then were subjected to OGD/R injury. The expression of PI3K/AKT pathways related core factors was tested using western blot. (C and E) PC12 cells were pretreated with 0.4 mg/ml SBD for different times (12, 24 and 48 h) and then were subjected to OGD/R. Western blot was used to determine the expression of PI3K/AKT pathway-related factors. *p < .05, **p < .01, ***p < .001 compared to the corresponding controls. Then, PC12 cells were pretreated with 0.4 mg/ml SBD single or in combination with LY294002 and then were subjected to OGD/R injury. (E) The expression of Nrf2 and (F) cell viability was respectively measured using western blot and MTT assay. *p < .05, **p < .01, ***p < .001 compared to Normal group. ##p < .01 compared to DMSO + OGD/R group. &p < .05, &&p < .01 compared to 0.4 mg/ml + OGD/R group. Data presented as mean ± SD (n = 3).